 ePub (Kindle)
 Printable PDF
Max MRR: Your growth ceiling


For years I’ve battled the same, tired misconceptions:
- “7% cancellation is fine, especially for consumer businesses.”
- “As long as I keep adding $300/mo of new MRR every month, I’ll build a real business.”
- “I’ll keep scaling past a few million in ARR by doing what I’ve always done.”
I’ve given real-world data to disprove these notions, but it’s still hard to internalize and to apply it to your own companies.
Rather than try to convince you again, I’m going to do something far more constructive: Give you a metric called Max MRR, that not only dispels false-justifications for high cancellations but is also predictive and updates monthly, which means it’s the kind of metric you can target, track, and iterate on. Because it’s a visceral, tangible number—not some abstract financial ratio—it cuts through the veil of willful ignorance.
Here’s how it works, along with a real-world example.
Buffer
Buffer is a widely beloved values-first bootstrapped company with one of the most popular tools for scheduling social media posts. Because their financial data is public (in another example of their special, enviable culture), and because they’ve gone through several strikingly different phases of growth, they are a perfect case-study for SaaS metrics. As we’ll see, our subject metric of “Max MRR” accurately characterizes their business better than other commonly-used metrics.
Buffer started growing modestly, and then quickly, as most successful companies do. After seven years of healthy growth, revenue topped out (before COVID) and then shrunk (during COVID), reaching a new, lower plateau by 2023. Then, after rebooting product, pricing, and their target market during 2023, revenue started going up again:

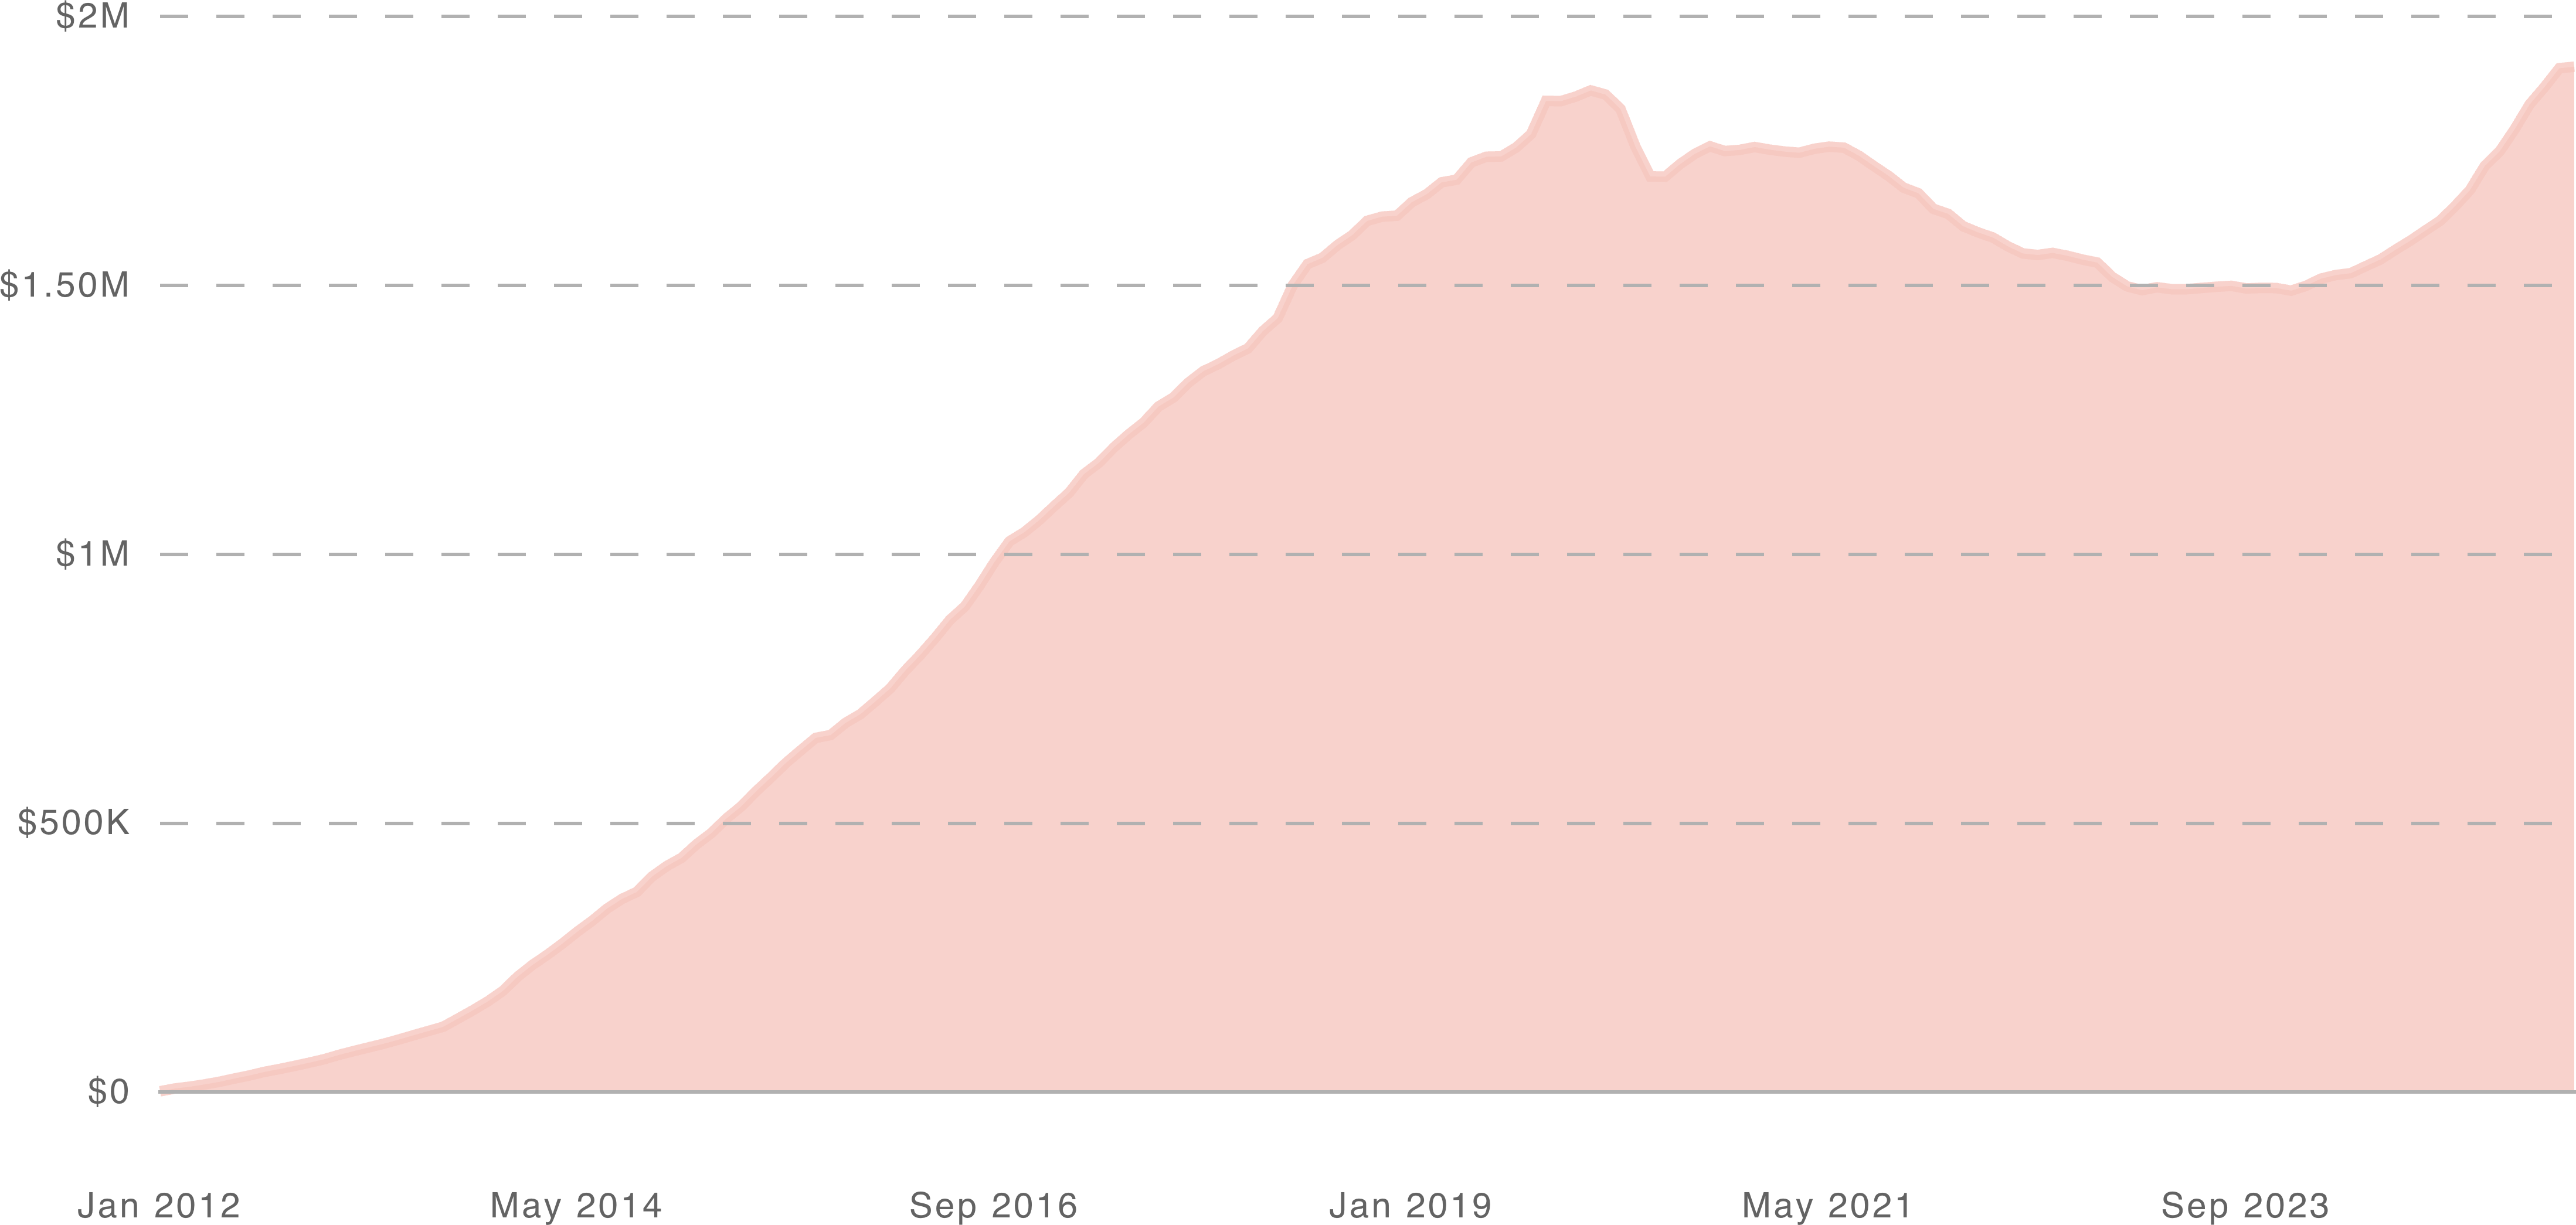
Figure 1: Buffer’s MRR over time, exhibiting the Elephant Curve until a strategic shift in 2023 reignited growth.
What was happening during those years when growth stopped? Was the customer base static? Not at all (Figure 2). During Buffer’s period of stagnation and shrinkage, it was experiencing more new customers and upgrades than ever before… but also even more cancellations and downgrades than ever before. Extremely dynamic, yet nevertheless flat overall.

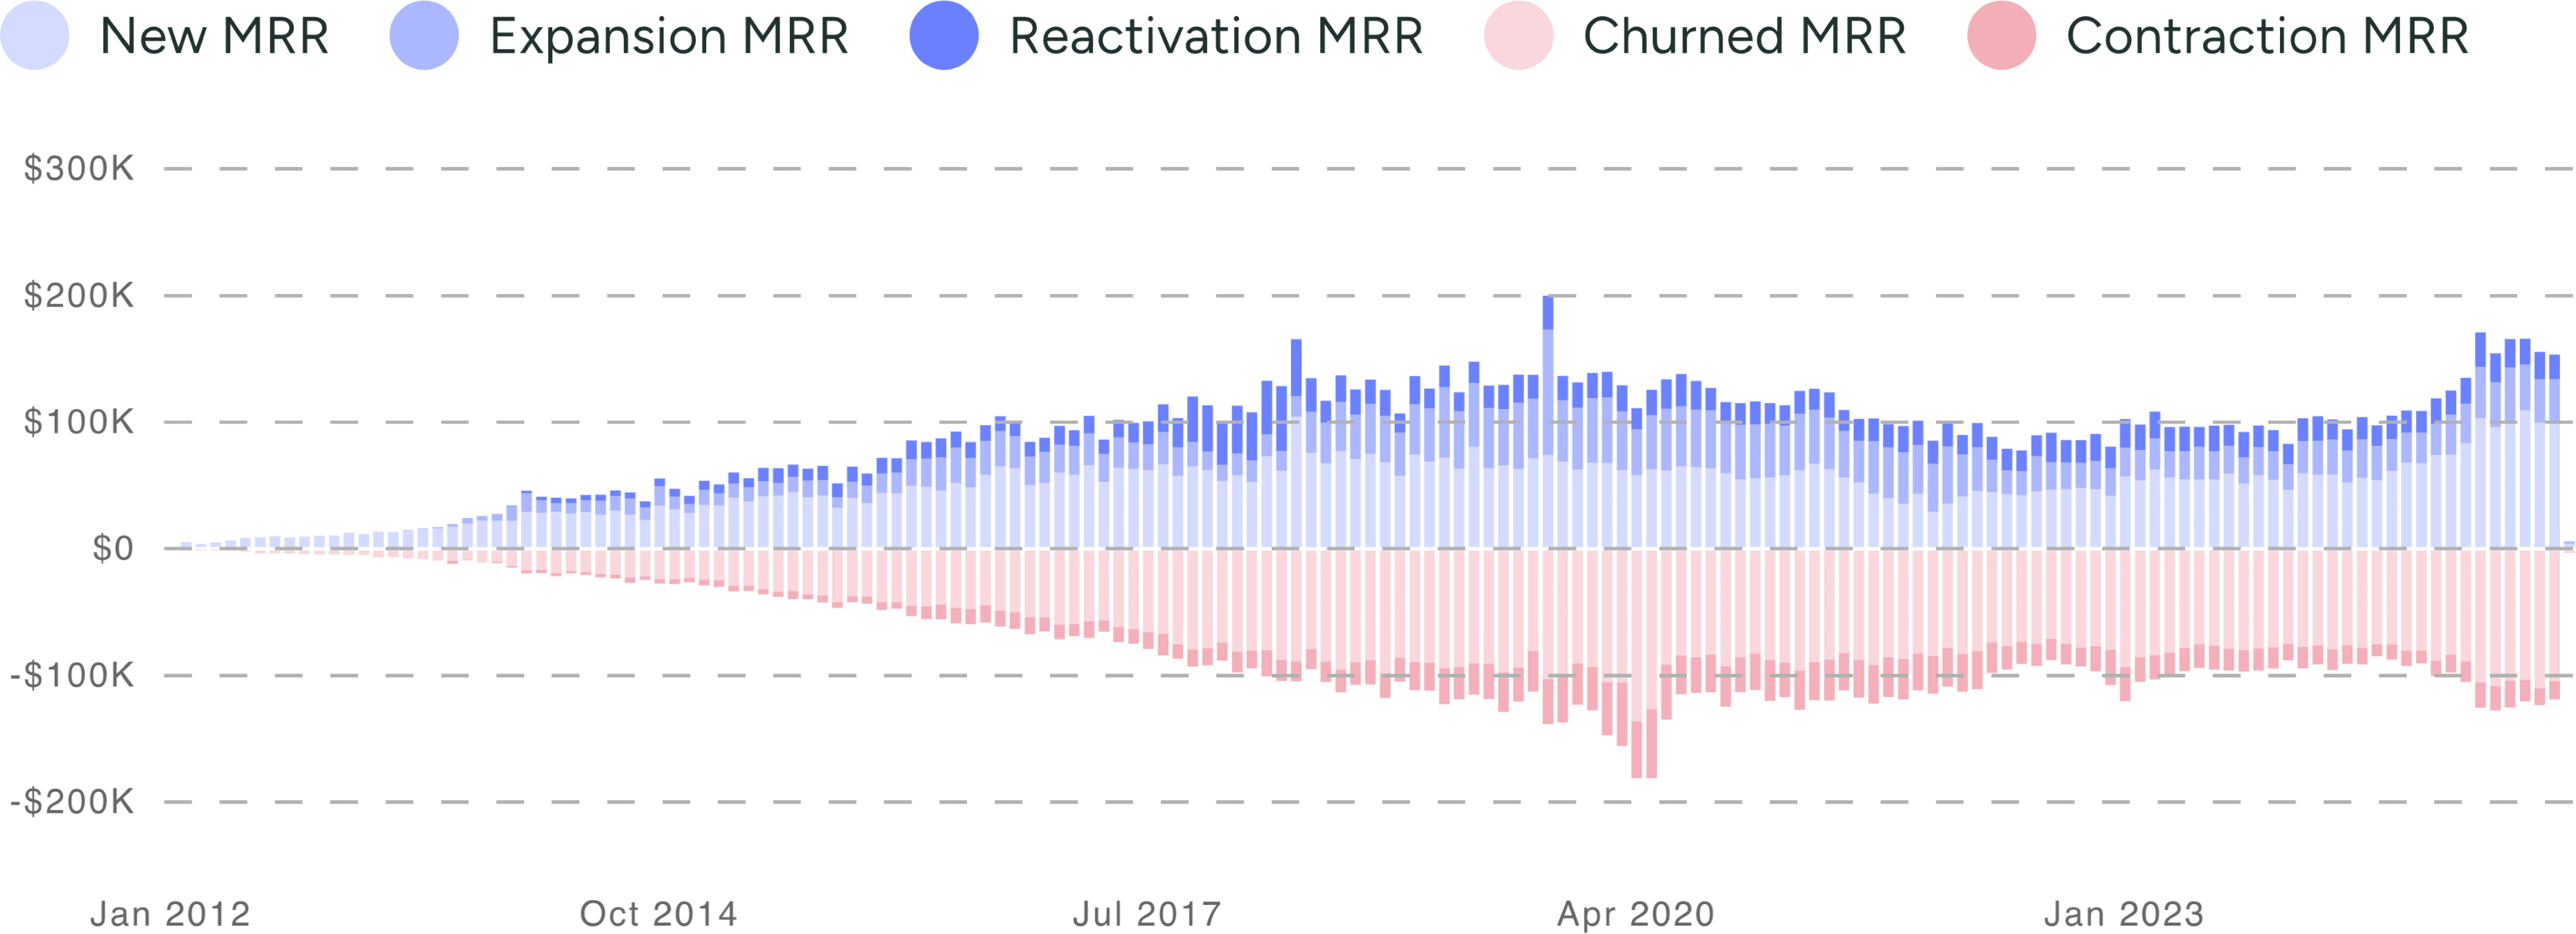
Figure 2: Buffer’s period of stagnation and shrinkage contained “more of everything” — new, cancels, upgrades, and downgrades.
The “Max MRR” metric is able to predict this capricious variation in revenue, months ahead of time. We’ll first construct a toy example to see how it works, and then apply it to Buffer.
The Max MRR Metric
Let’s explore a simple, hypothetical SaaS company, with stable growth metrics, as follows:
- Starting at $0 MRR
- +$1,000 new MRR each month from marketing and sales
- 5% cancellation each month from existing customers
Tracking MRR over time, it starts out growing nicely, reaching $10k MRR in 15 months, but then growth levels out, and it never reaches $20k MRR, even after 60 months:

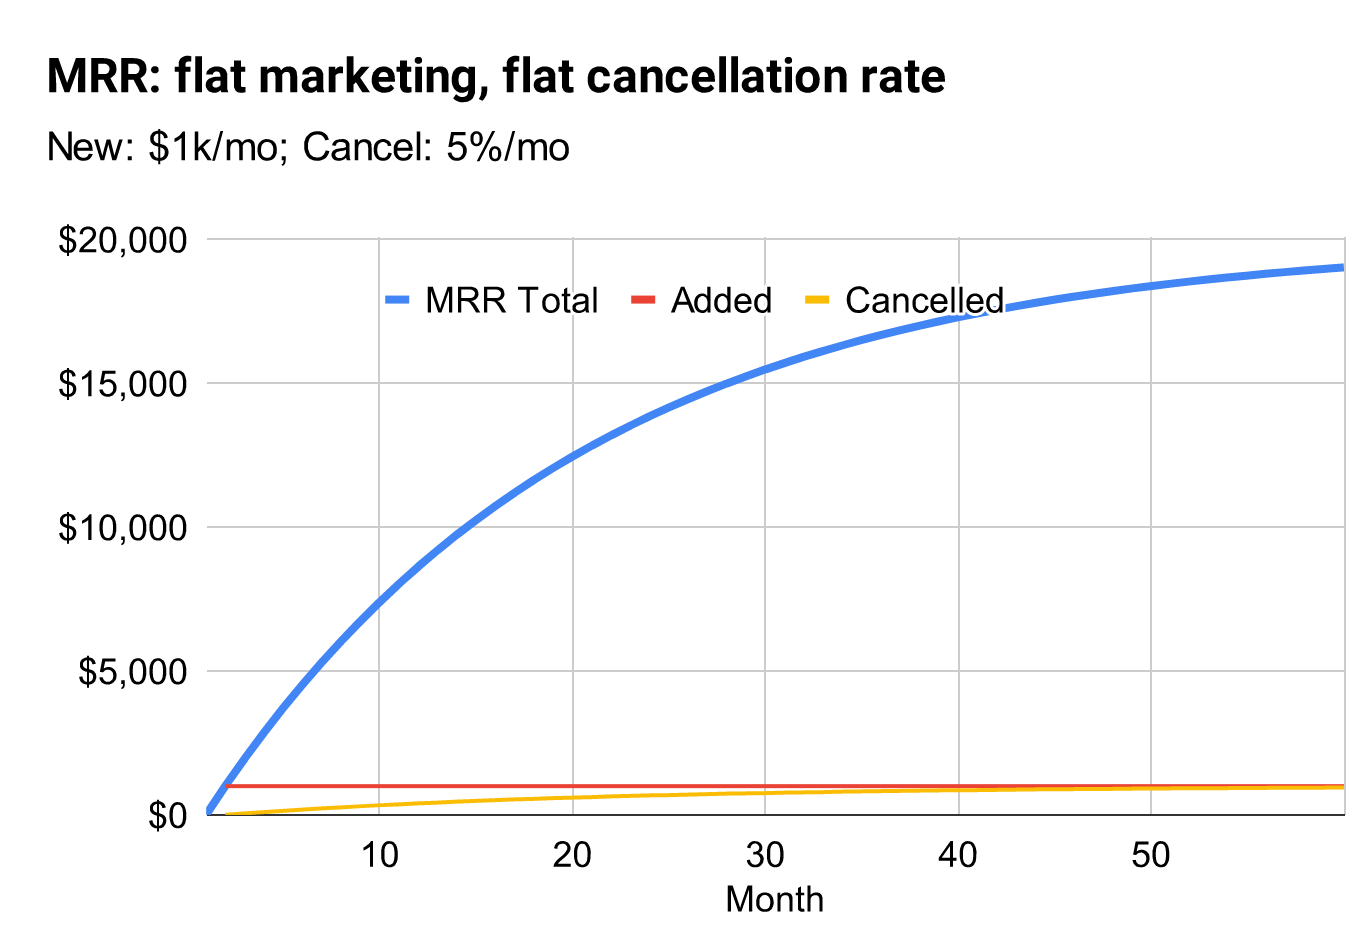
Figure 3
The reason this happens is that new MRR is chugging along at a constant pace (+$1000/mo), whereas cancellation is non-linear; it is proportional to how large the company is. The larger the company, the more absolute dollars of churn there is, even though the rate of churn is steady at 5%. As churn dollars grow, growth slows.
Eventually cancellation-dollars are just as large as new-dollars, and the company stops growing, reaching a steady-state.
What is this maximum size? Mathematically it’s trivial to compute; we just convert the previous sentence into numbers, where  is the monthly cancellation rate:
%22%3E%3Cg%20data-mml-node=%22math%22%3E%3Cg%20data-mml-node=%22mstyle%22%3E%3Cg%20data-mml-node=%22TeXAtom%22%20data-mjx-texclass=%22ORD%22%3E%3Cg%20data-mml-node=%22mtable%22%3E%3Cg%20data-mml-node=%22mtr%22%20transform=%22translate(0,1178)%22%3E%3Cg%20data-mml-node=%22mtd%22%3E%3Cg%20data-mml-node=%22msub%22%3E%3Cg%20data-mml-node=%22mtext%22%3E%3Cpath%20data-c=%224D%22%20d=%22M132%20622q-7%207-11%209t-16%203-43%203H29v46H135q86%200%2097-1t17-7q1-1%20105-277L458%20124%20562%20398Q666%20674%20668%20675q3%206%2015%207t98%201H887V637H854q-40-1-51-3t-18-12V61q6-10%2017-12t52-3h33V0H876Q855%203%20736%203%20605%203%20596%200H585V46h33q42%201%2051%203t19%2012V347q0%2077%200%20114t0%2085%200%2067l-1%2019Q454%2014%20450%207q-4-6-20-6T410%207q-1%202-118%20309L176%20624V606q-1-18-1-63t0-80%200-107l1-270q11-36%2085-40h17V0h-9Q254%203%20154%203%2052%203%2037%200H29V46H46q32%202%2052%2010t24%2013%2010%2017V622z%22/%3E%3Cpath%20data-c=%2252%22%20d=%22M130%20622q-7%207-11%209t-16%203-43%203H27v46H202h34%2064q76%200%20117-6t83-29q95-48%20109-131%201-5%201-16%200-33-16-62t-38-47-45-31-39-18l-16-5q3-3%2011-6%2030-16%2049-34t29-44%2014-43%209-56%2010-61q10-48%2024-63t38-15h5q15%200%2029%2016t18%2055q0%2011%204%2014t16%204%2016-2%204-13q0-31-16-63T672-16q-16-6-42-6Q481-16%20458%2090q-2%2011-2%2073t-7%2083q-19%2058-76%2074l-10%202-66%201H231V192l1-131q6-10%2017-12t52-3h33V0H323Q302%203%20181%203%2059%203%2038%200H27V46H60q42%201%2051%203t19%2012V622zM491%20499v10q0%2018-1%2030t-9%2031-19%2031-38%2022-62%2013q-2%200-22%200t-36%201H283q-45%200-49-9-3-4-3-136V360h58q101%200%20145%2018t55%2078q2%2011%202%2043z%22%20transform=%22translate(917,0)%22/%3E%3Cpath%20data-c=%2252%22%20d=%22M130%20622q-7%207-11%209t-16%203-43%203H27v46H202h34%2064q76%200%20117-6t83-29q95-48%20109-131%201-5%201-16%200-33-16-62t-38-47-45-31-39-18l-16-5q3-3%2011-6%2030-16%2049-34t29-44%2014-43%209-56%2010-61q10-48%2024-63t38-15h5q15%200%2029%2016t18%2055q0%2011%204%2014t16%204%2016-2%204-13q0-31-16-63T672-16q-16-6-42-6Q481-16%20458%2090q-2%2011-2%2073t-7%2083q-19%2058-76%2074l-10%202-66%201H231V192l1-131q6-10%2017-12t52-3h33V0H323Q302%203%20181%203%2059%203%2038%200H27V46H60q42%201%2051%203t19%2012V622zM491%20499v10q0%2018-1%2030t-9%2031-19%2031-38%2022-62%2013q-2%200-22%200t-36%201H283q-45%200-49-9-3-4-3-136V360h58q101%200%20145%2018t55%2078q2%2011%202%2043z%22%20transform=%22translate(1653,0)%22/%3E%3C/g%3E%3Cg%20data-mml-node=%22mtext%22%20transform=%22translate(2422,-150)%20scale(0.707)%22%3E%3Cpath%20data-c=%226D%22%20d=%22M41%2046H55q39%200%2047%2014v8q0%209%200%2023t0%2031%201%2039%200%2042q0%2031%200%2066t-1%2059v23q-3%2019-14%2025t-45%209H25v23q0%2023%202%2023l10%201q10%201%2028%202t37%202q17%201%2036%202t29%203%2011%201h3V402q0-38%201-38t5%205%2012%2015%2019%2018%2029%2019%2038%2016%2051%205q15%200%2028-2t23-6%2019-8%2015-9%2011-11%209-11%207-11%204-10%203-8l2-5%203%204q3%204%206%208t9%2011%2013%2013%2015%2013%2020%2012%2023%2010%2026%207%2031%203q126%200%20137-113%201-7%201-139V104q0-38%202-45t11-10q21-3%2049-3h16V0h-8L788%201q-24%201-51%201T699%203Q596%203%20587%200h-8V46h16q61%200%2061%2016%201%202%201%20138-1%20135-2%20143-6%2028-20%2042t-24%2017-26%202q-45%200-79-34-27-27-34-55t-8-83V168%20108q0-30%201-40t3-13%209-6q21-3%2049-3h16V0h-8L510%201q-23%201-50%201T422%203Q319%203%20310%200h-8V46h16q61%200%2061%2016%201%202%201%20138-1%20135-2%20143-6%2028-20%2042t-24%2017-26%202q-45%200-79-34-27-27-34-55t-8-83V168%20108q0-30%201-40t3-13%209-6q21-3%2049-3h16V0h-8L234%201q-24%201-51%201T145%203Q42%203%2033%200H25V46H41z%22/%3E%3Cpath%20data-c=%2261%22%20d=%22M137%20305t-22%200-37%2015-15%2039q0%2035%2034%2062t121%2027q73%200%20118-32t60-76q5-14%205-31t1-115V124q0-48%205-66t21-18q15%200%2020%2016t5%2053v36h40V106q-1-40-3-47-9-30-35-47T4e2-6%20353%2012%20329%2054v4l-2-3q-2-3-5-6t-8-9-12-11-15-12T269%206%20247-2%20221-8t-31-3Q130-11%2082%2020T34%20107q0%2021%207%2040t27%2041%2048%2037%2078%2028%20110%2015h14v22q0%2034-6%2050-22%2071-97%2071-18%200-34-1t-25-4-8-3q22-15%2022-44%200-25-16-39zM126%20106q0-31%2024-55t59-25q38%200%2067%2023t39%2060q2%207%203%2066%200%2058-1%2058-8%200-21-1t-45-9-58-20-46-37-21-60z%22%20transform=%22translate(833,0)%22/%3E%3Cpath%20data-c=%2278%22%20d=%22M201%200q-12%203-99%203Q26%203%2017%200H11V46H25q23%201%2042%206t29%209%2025%2017%2018%2018%2021%2026%2020%2028l46%2060-58%2078q-9%2013-19%2027t-16%2021-11%2015-9%2012-6%207-7%206-6%203-6%202-8%202q-6%200-36%202H16v46h7q36-2%20103-2%2093%200%20103%202h8V385q-36-4-36-16%200-2%2010-16t28-38%2029-41l4-4%2025%2034q32%2041%2032%2054%200%206-2%2011t-5%207-5%204-7%204l-3%201h-5v46h7q15-3%2099-3%2079%200%2085%203h6V385h-7q-49%200-81-17-17-8-34-27t-65-84l-16-21%2062-85q66-90%2071-94t17-7q18-4%2053-4h17V0h-6-8q-8%201-20%201T457%202%20432%202%20414%203q-11%200-37%200T327%201L304%200h-9V46h3q11%200%2022%205t11%2012q0%202-40%2057l-41%2055q-1-1-31-42T185%2088q-4-5-4-14%200-11%207-19t18-9q2%200%202-23V0h-7z%22%20transform=%22translate(1333,0)%22/%3E%3C/g%3E%3C/g%3E%3Cg%20data-mml-node=%22mo%22%20transform=%22translate(4010.1,0)%22%3E%3Cpath%20data-c=%22D7%22%20d=%22M630%2029q0-20-21-20-5%200-22%2016t-94%2093L389%20222%20284%20117Q178%2013%20175%2011q-4-2-7-2-8%200-14%206t-7%2014q0%207%2014%2022t94%2095L359%20250%20255%20354q-81%2081-94%2095t-14%2022q0%209%206%2014t15%205q5%200%207-1%203-2%20109-106L389%20278%20493%20382q77%2077%2094%2093t22%2016q21%200%2021-20%200-7-10-18t-98-98L418%20250%20522%20145q84-84%2096-97t12-19z%22/%3E%3C/g%3E%3Cg%20data-mml-node=%22mi%22%20transform=%22translate(5010.4,0)%22%3E%3Cpath%20data-c=%221D450%22%20d=%22M34%20159q0%20109%2086%20196t186%2087q56%200%2088-24t33-63q0-29-19-49t-48-21q-19%200-30%2010t-11%2030%2011%2034%2022%2021%2014%206h1q0%202-6%206t-21%208-34%204q-30%200-57-14-21-9-43-31-44-44-64-124T121%20119q0-46%2026-69%2022-24%2058-24h4q112%200%20185%2085%209%2010%2012%2010%204%200%2013-9t10-14-9-15-29-28-45-30T282%200%20202-11Q127-11%2081%2037T34%20159z%22/%3E%3C/g%3E%3C/g%3E%3Cg%20data-mml-node=%22mtd%22%20transform=%22translate(5443.4,0)%22%3E%3Cg%20data-mml-node=%22mi%22/%3E%3Cg%20data-mml-node=%22mo%22%20transform=%22translate(277.8,0)%22%3E%3Cpath%20data-c=%223D%22%20d=%22M56%20347q0%2013%2014%2020H707q15-8%2015-20%200-11-14-19l-318-1H72q-16%205-16%2020zm0-194q0%2015%2016%2020H708q14-10%2014-20%200-13-15-20H70q-14%207-14%2020z%22/%3E%3C/g%3E%3Cg%20data-mml-node=%22msub%22%20transform=%22translate(1333.6,0)%22%3E%3Cg%20data-mml-node=%22mtext%22%3E%3Cpath%20data-c=%224D%22%20d=%22M132%20622q-7%207-11%209t-16%203-43%203H29v46H135q86%200%2097-1t17-7q1-1%20105-277L458%20124%20562%20398Q666%20674%20668%20675q3%206%2015%207t98%201H887V637H854q-40-1-51-3t-18-12V61q6-10%2017-12t52-3h33V0H876Q855%203%20736%203%20605%203%20596%200H585V46h33q42%201%2051%203t19%2012V347q0%2077%200%20114t0%2085%200%2067l-1%2019Q454%2014%20450%207q-4-6-20-6T410%207q-1%202-118%20309L176%20624V606q-1-18-1-63t0-80%200-107l1-270q11-36%2085-40h17V0h-9Q254%203%20154%203%2052%203%2037%200H29V46H46q32%202%2052%2010t24%2013%2010%2017V622z%22/%3E%3Cpath%20data-c=%2252%22%20d=%22M130%20622q-7%207-11%209t-16%203-43%203H27v46H202h34%2064q76%200%20117-6t83-29q95-48%20109-131%201-5%201-16%200-33-16-62t-38-47-45-31-39-18l-16-5q3-3%2011-6%2030-16%2049-34t29-44%2014-43%209-56%2010-61q10-48%2024-63t38-15h5q15%200%2029%2016t18%2055q0%2011%204%2014t16%204%2016-2%204-13q0-31-16-63T672-16q-16-6-42-6Q481-16%20458%2090q-2%2011-2%2073t-7%2083q-19%2058-76%2074l-10%202-66%201H231V192l1-131q6-10%2017-12t52-3h33V0H323Q302%203%20181%203%2059%203%2038%200H27V46H60q42%201%2051%203t19%2012V622zM491%20499v10q0%2018-1%2030t-9%2031-19%2031-38%2022-62%2013q-2%200-22%200t-36%201H283q-45%200-49-9-3-4-3-136V360h58q101%200%20145%2018t55%2078q2%2011%202%2043z%22%20transform=%22translate(917,0)%22/%3E%3Cpath%20data-c=%2252%22%20d=%22M130%20622q-7%207-11%209t-16%203-43%203H27v46H202h34%2064q76%200%20117-6t83-29q95-48%20109-131%201-5%201-16%200-33-16-62t-38-47-45-31-39-18l-16-5q3-3%2011-6%2030-16%2049-34t29-44%2014-43%209-56%2010-61q10-48%2024-63t38-15h5q15%200%2029%2016t18%2055q0%2011%204%2014t16%204%2016-2%204-13q0-31-16-63T672-16q-16-6-42-6Q481-16%20458%2090q-2%2011-2%2073t-7%2083q-19%2058-76%2074l-10%202-66%201H231V192l1-131q6-10%2017-12t52-3h33V0H323Q302%203%20181%203%2059%203%2038%200H27V46H60q42%201%2051%203t19%2012V622zM491%20499v10q0%2018-1%2030t-9%2031-19%2031-38%2022-62%2013q-2%200-22%200t-36%201H283q-45%200-49-9-3-4-3-136V360h58q101%200%20145%2018t55%2078q2%2011%202%2043z%22%20transform=%22translate(1653,0)%22/%3E%3C/g%3E%3Cg%20data-mml-node=%22mtext%22%20transform=%22translate(2422,-150)%20scale(0.707)%22%3E%3Cpath%20data-c=%226E%22%20d=%22M41%2046H55q39%200%2047%2014v8q0%209%200%2023t0%2031%201%2039%200%2042q0%2031%200%2066t-1%2059v23q-3%2019-14%2025t-45%209H25v23q0%2023%202%2023l10%201q10%201%2028%202t37%202q17%201%2036%202t29%203%2011%201h3V402q0-38%201-38t5%205%2012%2015%2019%2018%2029%2019%2038%2016%2051%205q114-4%20127-113%201-7%201-139V104q0-38%202-45t11-10q21-3%2049-3h16V0h-8L510%201q-23%201-50%201T422%203Q319%203%20310%200h-8V46h16q61%200%2061%2016%201%202%201%20138-1%20135-2%20143-6%2028-20%2042t-24%2017-26%202q-45%200-79-34-27-27-34-55t-8-83V168%20108q0-30%201-40t3-13%209-6q21-3%2049-3h16V0h-8L234%201q-24%201-51%201T145%203Q42%203%2033%200H25V46H41z%22/%3E%3Cpath%20data-c=%2265%22%20d=%22M28%20218q0%2055%2020%201e2t50%2073%2065%2042%2066%2015q53%200%2091-18t58-50%2028-64%209-71q0-7-7-14H126V216Q126%2068%20226%2036q20-6%2044-6%2042%200%2072%2032%2017%2017%2027%2042l10%2024q3%203%2016%203h3q17%200%2017-10%200-4-3-13-19-55-63-87T250-11Q155-11%2092%2058T28%20218zm305%2057q-11%20128-95%20136h-2q-8%200-16-1t-25-8-29-21-23-41-16-66v-7H333v8z%22%20transform=%22translate(556,0)%22/%3E%3Cpath%20data-c=%2277%22%20d=%22M90%20368q-6%2010-14%2012t-36%205H18v46h6l19-1q19%200%2041-1t32-1q90%200%20105%203h8V385H215q-38-2-38-17%200-1%2044-129l44-126%2074%20215-6%2017q-10%2029-17%2034-8%205-38%206H258v46h6q6-3%2084-3%2091%200%20106%203h7V385h-9q-48%200-48-16%200-3%2014-45t31-90%2032-91l15-43%2041%20119q42%20122%2042%20128%200%2016-15%2026t-34%2012h-8v46h7q12-3%2095-3%2068%200%2074%203h5V385h-6q-1%200-6%200t-9-1q-47-7-63-50L559%20161q-13-37-31-90-20-59-25-70T487-11h-8q-19%200-23%207-1%201-49%20137L361%20267q-2-4-95-271-5-7-23-7h-5q-13%200-18%208L90%20368z%22%20transform=%22translate(1000,0)%22/%3E%3C/g%3E%3C/g%3E%3C/g%3E%3C/g%3E%3Cg%20data-mml-node=%22mtr%22%20transform=%22translate(0,-731)%22%3E%3Cg%20data-mml-node=%22mtd%22%20transform=%22translate(1655.4,0)%22%3E%3Cg%20data-mml-node=%22msub%22%3E%3Cg%20data-mml-node=%22mtext%22%3E%3Cpath%20data-c=%224D%22%20d=%22M132%20622q-7%207-11%209t-16%203-43%203H29v46H135q86%200%2097-1t17-7q1-1%20105-277L458%20124%20562%20398Q666%20674%20668%20675q3%206%2015%207t98%201H887V637H854q-40-1-51-3t-18-12V61q6-10%2017-12t52-3h33V0H876Q855%203%20736%203%20605%203%20596%200H585V46h33q42%201%2051%203t19%2012V347q0%2077%200%20114t0%2085%200%2067l-1%2019Q454%2014%20450%207q-4-6-20-6T410%207q-1%202-118%20309L176%20624V606q-1-18-1-63t0-80%200-107l1-270q11-36%2085-40h17V0h-9Q254%203%20154%203%2052%203%2037%200H29V46H46q32%202%2052%2010t24%2013%2010%2017V622z%22/%3E%3Cpath%20data-c=%2252%22%20d=%22M130%20622q-7%207-11%209t-16%203-43%203H27v46H202h34%2064q76%200%20117-6t83-29q95-48%20109-131%201-5%201-16%200-33-16-62t-38-47-45-31-39-18l-16-5q3-3%2011-6%2030-16%2049-34t29-44%2014-43%209-56%2010-61q10-48%2024-63t38-15h5q15%200%2029%2016t18%2055q0%2011%204%2014t16%204%2016-2%204-13q0-31-16-63T672-16q-16-6-42-6Q481-16%20458%2090q-2%2011-2%2073t-7%2083q-19%2058-76%2074l-10%202-66%201H231V192l1-131q6-10%2017-12t52-3h33V0H323Q302%203%20181%203%2059%203%2038%200H27V46H60q42%201%2051%203t19%2012V622zM491%20499v10q0%2018-1%2030t-9%2031-19%2031-38%2022-62%2013q-2%200-22%200t-36%201H283q-45%200-49-9-3-4-3-136V360h58q101%200%20145%2018t55%2078q2%2011%202%2043z%22%20transform=%22translate(917,0)%22/%3E%3Cpath%20data-c=%2252%22%20d=%22M130%20622q-7%207-11%209t-16%203-43%203H27v46H202h34%2064q76%200%20117-6t83-29q95-48%20109-131%201-5%201-16%200-33-16-62t-38-47-45-31-39-18l-16-5q3-3%2011-6%2030-16%2049-34t29-44%2014-43%209-56%2010-61q10-48%2024-63t38-15h5q15%200%2029%2016t18%2055q0%2011%204%2014t16%204%2016-2%204-13q0-31-16-63T672-16q-16-6-42-6Q481-16%20458%2090q-2%2011-2%2073t-7%2083q-19%2058-76%2074l-10%202-66%201H231V192l1-131q6-10%2017-12t52-3h33V0H323Q302%203%20181%203%2059%203%2038%200H27V46H60q42%201%2051%203t19%2012V622zM491%20499v10q0%2018-1%2030t-9%2031-19%2031-38%2022-62%2013q-2%200-22%200t-36%201H283q-45%200-49-9-3-4-3-136V360h58q101%200%20145%2018t55%2078q2%2011%202%2043z%22%20transform=%22translate(1653,0)%22/%3E%3C/g%3E%3Cg%20data-mml-node=%22mtext%22%20transform=%22translate(2422,-150)%20scale(0.707)%22%3E%3Cpath%20data-c=%226D%22%20d=%22M41%2046H55q39%200%2047%2014v8q0%209%200%2023t0%2031%201%2039%200%2042q0%2031%200%2066t-1%2059v23q-3%2019-14%2025t-45%209H25v23q0%2023%202%2023l10%201q10%201%2028%202t37%202q17%201%2036%202t29%203%2011%201h3V402q0-38%201-38t5%205%2012%2015%2019%2018%2029%2019%2038%2016%2051%205q15%200%2028-2t23-6%2019-8%2015-9%2011-11%209-11%207-11%204-10%203-8l2-5%203%204q3%204%206%208t9%2011%2013%2013%2015%2013%2020%2012%2023%2010%2026%207%2031%203q126%200%20137-113%201-7%201-139V104q0-38%202-45t11-10q21-3%2049-3h16V0h-8L788%201q-24%201-51%201T699%203Q596%203%20587%200h-8V46h16q61%200%2061%2016%201%202%201%20138-1%20135-2%20143-6%2028-20%2042t-24%2017-26%202q-45%200-79-34-27-27-34-55t-8-83V168%20108q0-30%201-40t3-13%209-6q21-3%2049-3h16V0h-8L510%201q-23%201-50%201T422%203Q319%203%20310%200h-8V46h16q61%200%2061%2016%201%202%201%20138-1%20135-2%20143-6%2028-20%2042t-24%2017-26%202q-45%200-79-34-27-27-34-55t-8-83V168%20108q0-30%201-40t3-13%209-6q21-3%2049-3h16V0h-8L234%201q-24%201-51%201T145%203Q42%203%2033%200H25V46H41z%22/%3E%3Cpath%20data-c=%2261%22%20d=%22M137%20305t-22%200-37%2015-15%2039q0%2035%2034%2062t121%2027q73%200%20118-32t60-76q5-14%205-31t1-115V124q0-48%205-66t21-18q15%200%2020%2016t5%2053v36h40V106q-1-40-3-47-9-30-35-47T4e2-6%20353%2012%20329%2054v4l-2-3q-2-3-5-6t-8-9-12-11-15-12T269%206%20247-2%20221-8t-31-3Q130-11%2082%2020T34%20107q0%2021%207%2040t27%2041%2048%2037%2078%2028%20110%2015h14v22q0%2034-6%2050-22%2071-97%2071-18%200-34-1t-25-4-8-3q22-15%2022-44%200-25-16-39zM126%20106q0-31%2024-55t59-25q38%200%2067%2023t39%2060q2%207%203%2066%200%2058-1%2058-8%200-21-1t-45-9-58-20-46-37-21-60z%22%20transform=%22translate(833,0)%22/%3E%3Cpath%20data-c=%2278%22%20d=%22M201%200q-12%203-99%203Q26%203%2017%200H11V46H25q23%201%2042%206t29%209%2025%2017%2018%2018%2021%2026%2020%2028l46%2060-58%2078q-9%2013-19%2027t-16%2021-11%2015-9%2012-6%207-7%206-6%203-6%202-8%202q-6%200-36%202H16v46h7q36-2%20103-2%2093%200%20103%202h8V385q-36-4-36-16%200-2%2010-16t28-38%2029-41l4-4%2025%2034q32%2041%2032%2054%200%206-2%2011t-5%207-5%204-7%204l-3%201h-5v46h7q15-3%2099-3%2079%200%2085%203h6V385h-7q-49%200-81-17-17-8-34-27t-65-84l-16-21%2062-85q66-90%2071-94t17-7q18-4%2053-4h17V0h-6-8q-8%201-20%201T457%202%20432%202%20414%203q-11%200-37%200T327%201L304%200h-9V46h3q11%200%2022%205t11%2012q0%202-40%2057l-41%2055q-1-1-31-42T185%2088q-4-5-4-14%200-11%207-19t18-9q2%200%202-23V0h-7z%22%20transform=%22translate(1333,0)%22/%3E%3C/g%3E%3C/g%3E%3C/g%3E%3Cg%20data-mml-node=%22mtd%22%20transform=%22translate(5443.4,0)%22%3E%3Cg%20data-mml-node=%22mi%22/%3E%3Cg%20data-mml-node=%22mo%22%20transform=%22translate(277.8,0)%22%3E%3Cpath%20data-c=%223D%22%20d=%22M56%20347q0%2013%2014%2020H707q15-8%2015-20%200-11-14-19l-318-1H72q-16%205-16%2020zm0-194q0%2015%2016%2020H708q14-10%2014-20%200-13-15-20H70q-14%207-14%2020z%22/%3E%3C/g%3E%3Cg%20data-mml-node=%22mstyle%22%20transform=%22translate(1333.6,0)%22%3E%3Cg%20data-mml-node=%22mfrac%22%3E%3Cg%20data-mml-node=%22msub%22%20transform=%22translate(220,676)%22%3E%3Cg%20data-mml-node=%22mtext%22%3E%3Cpath%20data-c=%224D%22%20d=%22M132%20622q-7%207-11%209t-16%203-43%203H29v46H135q86%200%2097-1t17-7q1-1%20105-277L458%20124%20562%20398Q666%20674%20668%20675q3%206%2015%207t98%201H887V637H854q-40-1-51-3t-18-12V61q6-10%2017-12t52-3h33V0H876Q855%203%20736%203%20605%203%20596%200H585V46h33q42%201%2051%203t19%2012V347q0%2077%200%20114t0%2085%200%2067l-1%2019Q454%2014%20450%207q-4-6-20-6T410%207q-1%202-118%20309L176%20624V606q-1-18-1-63t0-80%200-107l1-270q11-36%2085-40h17V0h-9Q254%203%20154%203%2052%203%2037%200H29V46H46q32%202%2052%2010t24%2013%2010%2017V622z%22/%3E%3Cpath%20data-c=%2252%22%20d=%22M130%20622q-7%207-11%209t-16%203-43%203H27v46H202h34%2064q76%200%20117-6t83-29q95-48%20109-131%201-5%201-16%200-33-16-62t-38-47-45-31-39-18l-16-5q3-3%2011-6%2030-16%2049-34t29-44%2014-43%209-56%2010-61q10-48%2024-63t38-15h5q15%200%2029%2016t18%2055q0%2011%204%2014t16%204%2016-2%204-13q0-31-16-63T672-16q-16-6-42-6Q481-16%20458%2090q-2%2011-2%2073t-7%2083q-19%2058-76%2074l-10%202-66%201H231V192l1-131q6-10%2017-12t52-3h33V0H323Q302%203%20181%203%2059%203%2038%200H27V46H60q42%201%2051%203t19%2012V622zM491%20499v10q0%2018-1%2030t-9%2031-19%2031-38%2022-62%2013q-2%200-22%200t-36%201H283q-45%200-49-9-3-4-3-136V360h58q101%200%20145%2018t55%2078q2%2011%202%2043z%22%20transform=%22translate(917,0)%22/%3E%3Cpath%20data-c=%2252%22%20d=%22M130%20622q-7%207-11%209t-16%203-43%203H27v46H202h34%2064q76%200%20117-6t83-29q95-48%20109-131%201-5%201-16%200-33-16-62t-38-47-45-31-39-18l-16-5q3-3%2011-6%2030-16%2049-34t29-44%2014-43%209-56%2010-61q10-48%2024-63t38-15h5q15%200%2029%2016t18%2055q0%2011%204%2014t16%204%2016-2%204-13q0-31-16-63T672-16q-16-6-42-6Q481-16%20458%2090q-2%2011-2%2073t-7%2083q-19%2058-76%2074l-10%202-66%201H231V192l1-131q6-10%2017-12t52-3h33V0H323Q302%203%20181%203%2059%203%2038%200H27V46H60q42%201%2051%203t19%2012V622zM491%20499v10q0%2018-1%2030t-9%2031-19%2031-38%2022-62%2013q-2%200-22%200t-36%201H283q-45%200-49-9-3-4-3-136V360h58q101%200%20145%2018t55%2078q2%2011%202%2043z%22%20transform=%22translate(1653,0)%22/%3E%3C/g%3E%3Cg%20data-mml-node=%22mtext%22%20transform=%22translate(2422,-150)%20scale(0.707)%22%3E%3Cpath%20data-c=%226E%22%20d=%22M41%2046H55q39%200%2047%2014v8q0%209%200%2023t0%2031%201%2039%200%2042q0%2031%200%2066t-1%2059v23q-3%2019-14%2025t-45%209H25v23q0%2023%202%2023l10%201q10%201%2028%202t37%202q17%201%2036%202t29%203%2011%201h3V402q0-38%201-38t5%205%2012%2015%2019%2018%2029%2019%2038%2016%2051%205q114-4%20127-113%201-7%201-139V104q0-38%202-45t11-10q21-3%2049-3h16V0h-8L510%201q-23%201-50%201T422%203Q319%203%20310%200h-8V46h16q61%200%2061%2016%201%202%201%20138-1%20135-2%20143-6%2028-20%2042t-24%2017-26%202q-45%200-79-34-27-27-34-55t-8-83V168%20108q0-30%201-40t3-13%209-6q21-3%2049-3h16V0h-8L234%201q-24%201-51%201T145%203Q42%203%2033%200H25V46H41z%22/%3E%3Cpath%20data-c=%2265%22%20d=%22M28%20218q0%2055%2020%201e2t50%2073%2065%2042%2066%2015q53%200%2091-18t58-50%2028-64%209-71q0-7-7-14H126V216Q126%2068%20226%2036q20-6%2044-6%2042%200%2072%2032%2017%2017%2027%2042l10%2024q3%203%2016%203h3q17%200%2017-10%200-4-3-13-19-55-63-87T250-11Q155-11%2092%2058T28%20218zm305%2057q-11%20128-95%20136h-2q-8%200-16-1t-25-8-29-21-23-41-16-66v-7H333v8z%22%20transform=%22translate(556,0)%22/%3E%3Cpath%20data-c=%2277%22%20d=%22M90%20368q-6%2010-14%2012t-36%205H18v46h6l19-1q19%200%2041-1t32-1q90%200%20105%203h8V385H215q-38-2-38-17%200-1%2044-129l44-126%2074%20215-6%2017q-10%2029-17%2034-8%205-38%206H258v46h6q6-3%2084-3%2091%200%20106%203h7V385h-9q-48%200-48-16%200-3%2014-45t31-90%2032-91l15-43%2041%20119q42%20122%2042%20128%200%2016-15%2026t-34%2012h-8v46h7q12-3%2095-3%2068%200%2074%203h5V385h-6q-1%200-6%200t-9-1q-47-7-63-50L559%20161q-13-37-31-90-20-59-25-70T487-11h-8q-19%200-23%207-1%201-49%20137L361%20267q-2-4-95-271-5-7-23-7h-5q-13%200-18%208L90%20368z%22%20transform=%22translate(1000,0)%22/%3E%3C/g%3E%3C/g%3E%3Cg%20data-mml-node=%22mi%22%20transform=%22translate(1848.3,-686)%22%3E%3Cpath%20data-c=%221D450%22%20d=%22M34%20159q0%20109%2086%20196t186%2087q56%200%2088-24t33-63q0-29-19-49t-48-21q-19%200-30%2010t-11%2030%2011%2034%2022%2021%2014%206h1q0%202-6%206t-21%208-34%204q-30%200-57-14-21-9-43-31-44-44-64-124T121%20119q0-46%2026-69%2022-24%2058-24h4q112%200%20185%2085%209%2010%2012%2010%204%200%2013-9t10-14-9-15-29-28-45-30T282%200%20202-11Q127-11%2081%2037T34%20159z%22/%3E%3C/g%3E%3Crect%20width=%223889.6%22%20height=%2260%22%20x=%22120%22%20y=%22220%22/%3E%3C/g%3E%3C/g%3E%3C/g%3E%3C/g%3E%3C/g%3E%3C/g%3E%3C/g%3E%3C/g%3E%3C/g%3E%3C/svg%3E)
In our toy example, %22%3E%3Cg%20data-mml-node=%22math%22%3E%3Cg%20data-mml-node=%22mstyle%22%3E%3Cg%20data-mml-node=%22TeXAtom%22%20data-mjx-texclass=%22ORD%22%3E%3Cg%20data-mml-node=%22msub%22%3E%3Cg%20data-mml-node=%22mtext%22%3E%3Cpath%20data-c=%224D%22%20d=%22M132%20622q-7%207-11%209t-16%203-43%203H29v46H135q86%200%2097-1t17-7q1-1%20105-277L458%20124%20562%20398Q666%20674%20668%20675q3%206%2015%207t98%201H887V637H854q-40-1-51-3t-18-12V61q6-10%2017-12t52-3h33V0H876Q855%203%20736%203%20605%203%20596%200H585V46h33q42%201%2051%203t19%2012V347q0%2077%200%20114t0%2085%200%2067l-1%2019Q454%2014%20450%207q-4-6-20-6T410%207q-1%202-118%20309L176%20624V606q-1-18-1-63t0-80%200-107l1-270q11-36%2085-40h17V0h-9Q254%203%20154%203%2052%203%2037%200H29V46H46q32%202%2052%2010t24%2013%2010%2017V622z%22/%3E%3Cpath%20data-c=%2252%22%20d=%22M130%20622q-7%207-11%209t-16%203-43%203H27v46H202h34%2064q76%200%20117-6t83-29q95-48%20109-131%201-5%201-16%200-33-16-62t-38-47-45-31-39-18l-16-5q3-3%2011-6%2030-16%2049-34t29-44%2014-43%209-56%2010-61q10-48%2024-63t38-15h5q15%200%2029%2016t18%2055q0%2011%204%2014t16%204%2016-2%204-13q0-31-16-63T672-16q-16-6-42-6Q481-16%20458%2090q-2%2011-2%2073t-7%2083q-19%2058-76%2074l-10%202-66%201H231V192l1-131q6-10%2017-12t52-3h33V0H323Q302%203%20181%203%2059%203%2038%200H27V46H60q42%201%2051%203t19%2012V622zM491%20499v10q0%2018-1%2030t-9%2031-19%2031-38%2022-62%2013q-2%200-22%200t-36%201H283q-45%200-49-9-3-4-3-136V360h58q101%200%20145%2018t55%2078q2%2011%202%2043z%22%20transform=%22translate(917,0)%22/%3E%3Cpath%20data-c=%2252%22%20d=%22M130%20622q-7%207-11%209t-16%203-43%203H27v46H202h34%2064q76%200%20117-6t83-29q95-48%20109-131%201-5%201-16%200-33-16-62t-38-47-45-31-39-18l-16-5q3-3%2011-6%2030-16%2049-34t29-44%2014-43%209-56%2010-61q10-48%2024-63t38-15h5q15%200%2029%2016t18%2055q0%2011%204%2014t16%204%2016-2%204-13q0-31-16-63T672-16q-16-6-42-6Q481-16%20458%2090q-2%2011-2%2073t-7%2083q-19%2058-76%2074l-10%202-66%201H231V192l1-131q6-10%2017-12t52-3h33V0H323Q302%203%20181%203%2059%203%2038%200H27V46H60q42%201%2051%203t19%2012V622zM491%20499v10q0%2018-1%2030t-9%2031-19%2031-38%2022-62%2013q-2%200-22%200t-36%201H283q-45%200-49-9-3-4-3-136V360h58q101%200%20145%2018t55%2078q2%2011%202%2043z%22%20transform=%22translate(1653,0)%22/%3E%3C/g%3E%3Cg%20data-mml-node=%22mtext%22%20transform=%22translate(2422,-150)%20scale(0.707)%22%3E%3Cpath%20data-c=%226E%22%20d=%22M41%2046H55q39%200%2047%2014v8q0%209%200%2023t0%2031%201%2039%200%2042q0%2031%200%2066t-1%2059v23q-3%2019-14%2025t-45%209H25v23q0%2023%202%2023l10%201q10%201%2028%202t37%202q17%201%2036%202t29%203%2011%201h3V402q0-38%201-38t5%205%2012%2015%2019%2018%2029%2019%2038%2016%2051%205q114-4%20127-113%201-7%201-139V104q0-38%202-45t11-10q21-3%2049-3h16V0h-8L510%201q-23%201-50%201T422%203Q319%203%20310%200h-8V46h16q61%200%2061%2016%201%202%201%20138-1%20135-2%20143-6%2028-20%2042t-24%2017-26%202q-45%200-79-34-27-27-34-55t-8-83V168%20108q0-30%201-40t3-13%209-6q21-3%2049-3h16V0h-8L234%201q-24%201-51%201T145%203Q42%203%2033%200H25V46H41z%22/%3E%3Cpath%20data-c=%2265%22%20d=%22M28%20218q0%2055%2020%201e2t50%2073%2065%2042%2066%2015q53%200%2091-18t58-50%2028-64%209-71q0-7-7-14H126V216Q126%2068%20226%2036q20-6%2044-6%2042%200%2072%2032%2017%2017%2027%2042l10%2024q3%203%2016%203h3q17%200%2017-10%200-4-3-13-19-55-63-87T250-11Q155-11%2092%2058T28%20218zm305%2057q-11%20128-95%20136h-2q-8%200-16-1t-25-8-29-21-23-41-16-66v-7H333v8z%22%20transform=%22translate(556,0)%22/%3E%3Cpath%20data-c=%2277%22%20d=%22M90%20368q-6%2010-14%2012t-36%205H18v46h6l19-1q19%200%2041-1t32-1q90%200%20105%203h8V385H215q-38-2-38-17%200-1%2044-129l44-126%2074%20215-6%2017q-10%2029-17%2034-8%205-38%206H258v46h6q6-3%2084-3%2091%200%20106%203h7V385h-9q-48%200-48-16%200-3%2014-45t31-90%2032-91l15-43%2041%20119q42%20122%2042%20128%200%2016-15%2026t-34%2012h-8v46h7q12-3%2095-3%2068%200%2074%203h5V385h-6q-1%200-6%200t-9-1q-47-7-63-50L559%20161q-13-37-31-90-20-59-25-70T487-11h-8q-19%200-23%207-1%201-49%20137L361%20267q-2-4-95-271-5-7-23-7h-5q-13%200-18%208L90%20368z%22%20transform=%22translate(1000,0)%22/%3E%3C/g%3E%3C/g%3E%3Cg%20data-mml-node=%22mo%22%20transform=%22translate(3967.4,0)%22%3E%3Cpath%20data-c=%223D%22%20d=%22M56%20347q0%2013%2014%2020H707q15-8%2015-20%200-11-14-19l-318-1H72q-16%205-16%2020zm0-194q0%2015%2016%2020H708q14-10%2014-20%200-13-15-20H70q-14%207-14%2020z%22/%3E%3C/g%3E%3Cg%20data-mml-node=%22mi%22%20transform=%22translate(5023.2,0)%22%3E%3Cpath%20data-c=%2224%22%20d=%22M162%20187q0-23-16-38t-37-16h-6v-3q5-15%2012-25%207-13%2016-23t19-18%2020-12%2020-8%2016-4%2014-3l7-1V313q-37%207-65%2022-46%2023-76%2069T55%20508q0%2059%2030%20106t80%2071q21%2011%2060%2019h2v46h46V704l13-1q83-13%20127-72%2028-43%2031-1e2.0-17-1-22-4-19-18-30t-34-11q-23%200-38%2015t-16%2039q0%2024%2016%2038t37%2015l4%201v2q-8%2021-22%2036t-30%2023-28%2012-26%207l-15%202V408l15-3q41-11%2067-29%2041-28%2065-76t24-101q0-69-36-123T313%201Q286-9%20276-9h-3V-56H227v46h-6q-19%204-28%206T155%2011%20108%2041%2074%2094%2055%20176v6q0%2045%2040%2056%208%202%2013%202%2021%200%2037-14t17-39zm63%20470q-6%200-21-6t-35-19-34-38-14-56q0-26%2010-47t25-34%2031-22%2026-12%2014-3V539q0%20118-2%20118zM378%20169q0%2061-39%2096t-65%2036q-1%200-1-132V37q51%2013%2078%2050t27%2082z%22/%3E%3C/g%3E%3Cg%20data-mml-node=%22mn%22%20transform=%22translate(5523.2,0)%22%3E%3Cpath%20data-c=%2231%22%20d=%22M213%20578l-13-5q-14-5-40-10t-58-7H83v46h19q47%202%2087%2015t56%2024%2028%2022q2%203%2012%203%209%200%2017-6V361l1-3e2q7-7%2012-9t24-4%2062-2h26V0H416Q395%203%20257%203%20121%203%201e2.0H88V46h26q22%200%2038%200t25%201%2016%203%208%202%206%205%206%204V578z%22/%3E%3Cpath%20data-c=%2230%22%20d=%22M96%20585q56%2081%20153%2081%2048%200%2096-26t78-92q37-83%2037-228%200-155-43-237-20-42-55-67T301-15t-51-7q-26%200-52%206T137%2016%2082%2083Q39%20165%2039%20320q0%20174%2057%20265zm225%2012q-30%2032-71%2032-42%200-72-32-25-26-33-72t-8-192q0-158%208-208t36-79q28-30%2069-30%2040%200%2068%2030%2029%2030%2036%2084t8%20203q0%20145-8%20191t-33%2073z%22%20transform=%22translate(500,0)%22/%3E%3Cpath%20data-c=%2230%22%20d=%22M96%20585q56%2081%20153%2081%2048%200%2096-26t78-92q37-83%2037-228%200-155-43-237-20-42-55-67T301-15t-51-7q-26%200-52%206T137%2016%2082%2083Q39%20165%2039%20320q0%20174%2057%20265zm225%2012q-30%2032-71%2032-42%200-72-32-25-26-33-72t-8-192q0-158%208-208t36-79q28-30%2069-30%2040%200%2068%2030%2029%2030%2036%2084t8%20203q0%20145-8%20191t-33%2073z%22%20transform=%22translate(1000,0)%22/%3E%3Cpath%20data-c=%2230%22%20d=%22M96%20585q56%2081%20153%2081%2048%200%2096-26t78-92q37-83%2037-228%200-155-43-237-20-42-55-67T301-15t-51-7q-26%200-52%206T137%2016%2082%2083Q39%20165%2039%20320q0%20174%2057%20265zm225%2012q-30%2032-71%2032-42%200-72-32-25-26-33-72t-8-192q0-158%208-208t36-79q28-30%2069-30%2040%200%2068%2030%2029%2030%2036%2084t8%20203q0%20145-8%20191t-33%2073z%22%20transform=%22translate(1500,0)%22/%3E%3C/g%3E%3C/g%3E%3C/g%3E%3C/g%3E%3C/g%3E%3C/svg%3E) and
and %22%3E%3Cg%20data-mml-node=%22math%22%3E%3Cg%20data-mml-node=%22mstyle%22%3E%3Cg%20data-mml-node=%22TeXAtom%22%20data-mjx-texclass=%22ORD%22%3E%3Cg%20data-mml-node=%22mi%22%3E%3Cpath%20data-c=%221D450%22%20d=%22M34%20159q0%20109%2086%20196t186%2087q56%200%2088-24t33-63q0-29-19-49t-48-21q-19%200-30%2010t-11%2030%2011%2034%2022%2021%2014%206h1q0%202-6%206t-21%208-34%204q-30%200-57-14-21-9-43-31-44-44-64-124T121%20119q0-46%2026-69%2022-24%2058-24h4q112%200%20185%2085%209%2010%2012%2010%204%200%2013-9t10-14-9-15-29-28-45-30T282%200%20202-11Q127-11%2081%2037T34%20159z%22/%3E%3C/g%3E%3Cg%20data-mml-node=%22mo%22%20transform=%22translate(710.8,0)%22%3E%3Cpath%20data-c=%223D%22%20d=%22M56%20347q0%2013%2014%2020H707q15-8%2015-20%200-11-14-19l-318-1H72q-16%205-16%2020zm0-194q0%2015%2016%2020H708q14-10%2014-20%200-13-15-20H70q-14%207-14%2020z%22/%3E%3C/g%3E%3Cg%20data-mml-node=%22mn%22%20transform=%22translate(1766.6,0)%22%3E%3Cpath%20data-c=%2230%22%20d=%22M96%20585q56%2081%20153%2081%2048%200%2096-26t78-92q37-83%2037-228%200-155-43-237-20-42-55-67T301-15t-51-7q-26%200-52%206T137%2016%2082%2083Q39%20165%2039%20320q0%20174%2057%20265zm225%2012q-30%2032-71%2032-42%200-72-32-25-26-33-72t-8-192q0-158%208-208t36-79q28-30%2069-30%2040%200%2068%2030%2029%2030%2036%2084t8%20203q0%20145-8%20191t-33%2073z%22/%3E%3Cpath%20data-c=%222E%22%20d=%22M78%2060q0%2024%2017%2042t43%2018q24%200%2042-16t19-43q0-25-17-43T139%200%2096%2017%2078%2060z%22%20transform=%22translate(500,0)%22/%3E%3Cpath%20data-c=%2230%22%20d=%22M96%20585q56%2081%20153%2081%2048%200%2096-26t78-92q37-83%2037-228%200-155-43-237-20-42-55-67T301-15t-51-7q-26%200-52%206T137%2016%2082%2083Q39%20165%2039%20320q0%20174%2057%20265zm225%2012q-30%2032-71%2032-42%200-72-32-25-26-33-72t-8-192q0-158%208-208t36-79q28-30%2069-30%2040%200%2068%2030%2029%2030%2036%2084t8%20203q0%20145-8%20191t-33%2073z%22%20transform=%22translate(778,0)%22/%3E%3Cpath%20data-c=%2235%22%20d=%22M164%20157q0-24-16-40t-39-16h-7q46-79%20122-79%2070%200%20102%2060%2019%2033%2019%20128%200%20103-27%20139-26%2033-58%2033h-6q-78%200-118-68-4-7-7-8t-15-2q-17%200-19%206-2%204-2%20175V614q0%2050%205%2050%202%202%204%202%201%200%2021-8t55-16%2075-8q71%200%20136%2028%208%204%2013%204%208%200%208-18V635q-82-97-205-97-31%200-56%206l-10%202V374q19%2014%2030%2022t36%2016%2051%208q81%200%20137-65t56-154q0-92-64-157T229-22Q148-22%2099%2032T50%20154q0%2024%2011%2038t23%2018%2023%204q25%200%2041-17t16-40z%22%20transform=%22translate(1278,0)%22/%3E%3C/g%3E%3C/g%3E%3C/g%3E%3C/g%3E%3C/g%3E%3C/svg%3E) , so the maximum total revenue is
, so the maximum total revenue is %22%3E%3Cg%20data-mml-node=%22math%22%3E%3Cg%20data-mml-node=%22mstyle%22%3E%3Cg%20data-mml-node=%22TeXAtom%22%20data-mjx-texclass=%22ORD%22%3E%3Cg%20data-mml-node=%22mfrac%22%3E%3Cg%20data-mml-node=%22mrow%22%20transform=%22translate(220,394)%20scale(0.707)%22%3E%3Cg%20data-mml-node=%22mi%22%3E%3Cpath%20data-c=%2224%22%20d=%22M162%20187q0-23-16-38t-37-16h-6v-3q5-15%2012-25%207-13%2016-23t19-18%2020-12%2020-8%2016-4%2014-3l7-1V313q-37%207-65%2022-46%2023-76%2069T55%20508q0%2059%2030%20106t80%2071q21%2011%2060%2019h2v46h46V704l13-1q83-13%20127-72%2028-43%2031-1e2.0-17-1-22-4-19-18-30t-34-11q-23%200-38%2015t-16%2039q0%2024%2016%2038t37%2015l4%201v2q-8%2021-22%2036t-30%2023-28%2012-26%207l-15%202V408l15-3q41-11%2067-29%2041-28%2065-76t24-101q0-69-36-123T313%201Q286-9%20276-9h-3V-56H227v46h-6q-19%204-28%206T155%2011%20108%2041%2074%2094%2055%20176v6q0%2045%2040%2056%208%202%2013%202%2021%200%2037-14t17-39zm63%20470q-6%200-21-6t-35-19-34-38-14-56q0-26%2010-47t25-34%2031-22%2026-12%2014-3V539q0%20118-2%20118zM378%20169q0%2061-39%2096t-65%2036q-1%200-1-132V37q51%2013%2078%2050t27%2082z%22/%3E%3C/g%3E%3Cg%20data-mml-node=%22mn%22%20transform=%22translate(500,0)%22%3E%3Cpath%20data-c=%2231%22%20d=%22M213%20578l-13-5q-14-5-40-10t-58-7H83v46h19q47%202%2087%2015t56%2024%2028%2022q2%203%2012%203%209%200%2017-6V361l1-3e2q7-7%2012-9t24-4%2062-2h26V0H416Q395%203%20257%203%20121%203%201e2.0H88V46h26q22%200%2038%200t25%201%2016%203%208%202%206%205%206%204V578z%22/%3E%3Cpath%20data-c=%2230%22%20d=%22M96%20585q56%2081%20153%2081%2048%200%2096-26t78-92q37-83%2037-228%200-155-43-237-20-42-55-67T301-15t-51-7q-26%200-52%206T137%2016%2082%2083Q39%20165%2039%20320q0%20174%2057%20265zm225%2012q-30%2032-71%2032-42%200-72-32-25-26-33-72t-8-192q0-158%208-208t36-79q28-30%2069-30%2040%200%2068%2030%2029%2030%2036%2084t8%20203q0%20145-8%20191t-33%2073z%22%20transform=%22translate(500,0)%22/%3E%3Cpath%20data-c=%2230%22%20d=%22M96%20585q56%2081%20153%2081%2048%200%2096-26t78-92q37-83%2037-228%200-155-43-237-20-42-55-67T301-15t-51-7q-26%200-52%206T137%2016%2082%2083Q39%20165%2039%20320q0%20174%2057%20265zm225%2012q-30%2032-71%2032-42%200-72-32-25-26-33-72t-8-192q0-158%208-208t36-79q28-30%2069-30%2040%200%2068%2030%2029%2030%2036%2084t8%20203q0%20145-8%20191t-33%2073z%22%20transform=%22translate(1000,0)%22/%3E%3Cpath%20data-c=%2230%22%20d=%22M96%20585q56%2081%20153%2081%2048%200%2096-26t78-92q37-83%2037-228%200-155-43-237-20-42-55-67T301-15t-51-7q-26%200-52%206T137%2016%2082%2083Q39%20165%2039%20320q0%20174%2057%20265zm225%2012q-30%2032-71%2032-42%200-72-32-25-26-33-72t-8-192q0-158%208-208t36-79q28-30%2069-30%2040%200%2068%2030%2029%2030%2036%2084t8%20203q0%20145-8%20191t-33%2073z%22%20transform=%22translate(1500,0)%22/%3E%3C/g%3E%3C/g%3E%3Cg%20data-mml-node=%22mn%22%20transform=%22translate(475.3,-345)%20scale(0.707)%22%3E%3Cpath%20data-c=%2230%22%20d=%22M96%20585q56%2081%20153%2081%2048%200%2096-26t78-92q37-83%2037-228%200-155-43-237-20-42-55-67T301-15t-51-7q-26%200-52%206T137%2016%2082%2083Q39%20165%2039%20320q0%20174%2057%20265zm225%2012q-30%2032-71%2032-42%200-72-32-25-26-33-72t-8-192q0-158%208-208t36-79q28-30%2069-30%2040%200%2068%2030%2029%2030%2036%2084t8%20203q0%20145-8%20191t-33%2073z%22/%3E%3Cpath%20data-c=%222E%22%20d=%22M78%2060q0%2024%2017%2042t43%2018q24%200%2042-16t19-43q0-25-17-43T139%200%2096%2017%2078%2060z%22%20transform=%22translate(500,0)%22/%3E%3Cpath%20data-c=%2230%22%20d=%22M96%20585q56%2081%20153%2081%2048%200%2096-26t78-92q37-83%2037-228%200-155-43-237-20-42-55-67T301-15t-51-7q-26%200-52%206T137%2016%2082%2083Q39%20165%2039%20320q0%20174%2057%20265zm225%2012q-30%2032-71%2032-42%200-72-32-25-26-33-72t-8-192q0-158%208-208t36-79q28-30%2069-30%2040%200%2068%2030%2029%2030%2036%2084t8%20203q0%20145-8%20191t-33%2073z%22%20transform=%22translate(778,0)%22/%3E%3Cpath%20data-c=%2235%22%20d=%22M164%20157q0-24-16-40t-39-16h-7q46-79%20122-79%2070%200%20102%2060%2019%2033%2019%20128%200%20103-27%20139-26%2033-58%2033h-6q-78%200-118-68-4-7-7-8t-15-2q-17%200-19%206-2%204-2%20175V614q0%2050%205%2050%202%202%204%202%201%200%2021-8t55-16%2075-8q71%200%20136%2028%208%204%2013%204%208%200%208-18V635q-82-97-205-97-31%200-56%206l-10%202V374q19%2014%2030%2022t36%2016%2051%208q81%200%20137-65t56-154q0-92-64-157T229-22Q148-22%2099%2032T50%20154q0%2024%2011%2038t23%2018%2023%204q25%200%2041-17t16-40z%22%20transform=%22translate(1278,0)%22/%3E%3C/g%3E%3Crect%20width=%221967.8%22%20height=%2260%22%20x=%22120%22%20y=%22220%22/%3E%3C/g%3E%3Cg%20data-mml-node=%22mo%22%20transform=%22translate(2485.5,0)%22%3E%3Cpath%20data-c=%223D%22%20d=%22M56%20347q0%2013%2014%2020H707q15-8%2015-20%200-11-14-19l-318-1H72q-16%205-16%2020zm0-194q0%2015%2016%2020H708q14-10%2014-20%200-13-15-20H70q-14%207-14%2020z%22/%3E%3C/g%3E%3Cg%20data-mml-node=%22mi%22%20transform=%22translate(3541.3,0)%22%3E%3Cpath%20data-c=%2224%22%20d=%22M162%20187q0-23-16-38t-37-16h-6v-3q5-15%2012-25%207-13%2016-23t19-18%2020-12%2020-8%2016-4%2014-3l7-1V313q-37%207-65%2022-46%2023-76%2069T55%20508q0%2059%2030%20106t80%2071q21%2011%2060%2019h2v46h46V704l13-1q83-13%20127-72%2028-43%2031-1e2.0-17-1-22-4-19-18-30t-34-11q-23%200-38%2015t-16%2039q0%2024%2016%2038t37%2015l4%201v2q-8%2021-22%2036t-30%2023-28%2012-26%207l-15%202V408l15-3q41-11%2067-29%2041-28%2065-76t24-101q0-69-36-123T313%201Q286-9%20276-9h-3V-56H227v46h-6q-19%204-28%206T155%2011%20108%2041%2074%2094%2055%20176v6q0%2045%2040%2056%208%202%2013%202%2021%200%2037-14t17-39zm63%20470q-6%200-21-6t-35-19-34-38-14-56q0-26%2010-47t25-34%2031-22%2026-12%2014-3V539q0%20118-2%20118zM378%20169q0%2061-39%2096t-65%2036q-1%200-1-132V37q51%2013%2078%2050t27%2082z%22/%3E%3C/g%3E%3Cg%20data-mml-node=%22mn%22%20transform=%22translate(4041.3,0)%22%3E%3Cpath%20data-c=%2232%22%20d=%22M109%20429q-27%200-43%2018T50%20491q0%2071%2053%20123t132%2052q91%200%20152-56t62-145q0-43-20-82t-48-68-80-74q-36-31-1e2-92L142%2093l76-1q157%200%20167%205%207%202%2024%2089v3h40v-3q-1-3-13-91T421%203V0H50V19%2031q0%207%206%2015T86%2081q29%2032%2050%2056%209%2010%2034%2037t34%2037%2029%2033%2028%2034%2023%2030%2021%2032%2015%2029%2013%2032%207%2030%203%2033q0%2063-34%20109t-97%2046q-33%200-58-17t-35-33-10-19q0-1%205-1%2018%200%2037-14t19-46q0-25-16-42t-45-18z%22/%3E%3Cpath%20data-c=%2230%22%20d=%22M96%20585q56%2081%20153%2081%2048%200%2096-26t78-92q37-83%2037-228%200-155-43-237-20-42-55-67T301-15t-51-7q-26%200-52%206T137%2016%2082%2083Q39%20165%2039%20320q0%20174%2057%20265zm225%2012q-30%2032-71%2032-42%200-72-32-25-26-33-72t-8-192q0-158%208-208t36-79q28-30%2069-30%2040%200%2068%2030%2029%2030%2036%2084t8%20203q0%20145-8%20191t-33%2073z%22%20transform=%22translate(500,0)%22/%3E%3Cpath%20data-c=%222C%22%20d=%22M78%2035t0%2025%2016%2043%2043%2018q28%200%2050-25T210%208q0-35-9-68t-21-57-26-41-24-27-13-9q-4%200-13%209t-9%2013%2011%2016%2025%2030%2026%2050T173-3V9l-1-1q-2-1-5-2t-6-3-9-2-12-1Q113%200%2096%2017z%22%20transform=%22translate(1000,0)%22/%3E%3Cpath%20data-c=%2230%22%20d=%22M96%20585q56%2081%20153%2081%2048%200%2096-26t78-92q37-83%2037-228%200-155-43-237-20-42-55-67T301-15t-51-7q-26%200-52%206T137%2016%2082%2083Q39%20165%2039%20320q0%20174%2057%20265zm225%2012q-30%2032-71%2032-42%200-72-32-25-26-33-72t-8-192q0-158%208-208t36-79q28-30%2069-30%2040%200%2068%2030%2029%2030%2036%2084t8%20203q0%20145-8%20191t-33%2073z%22%20transform=%22translate(1278,0)%22/%3E%3Cpath%20data-c=%2230%22%20d=%22M96%20585q56%2081%20153%2081%2048%200%2096-26t78-92q37-83%2037-228%200-155-43-237-20-42-55-67T301-15t-51-7q-26%200-52%206T137%2016%2082%2083Q39%20165%2039%20320q0%20174%2057%20265zm225%2012q-30%2032-71%2032-42%200-72-32-25-26-33-72t-8-192q0-158%208-208t36-79q28-30%2069-30%2040%200%2068%2030%2029%2030%2036%2084t8%20203q0%20145-8%20191t-33%2073z%22%20transform=%22translate(1778,0)%22/%3E%3Cpath%20data-c=%2230%22%20d=%22M96%20585q56%2081%20153%2081%2048%200%2096-26t78-92q37-83%2037-228%200-155-43-237-20-42-55-67T301-15t-51-7q-26%200-52%206T137%2016%2082%2083Q39%20165%2039%20320q0%20174%2057%20265zm225%2012q-30%2032-71%2032-42%200-72-32-25-26-33-72t-8-192q0-158%208-208t36-79q28-30%2069-30%2040%200%2068%2030%2029%2030%2036%2084t8%20203q0%20145-8%20191t-33%2073z%22%20transform=%22translate(2278,0)%22/%3E%3C/g%3E%3C/g%3E%3C/g%3E%3C/g%3E%3C/g%3E%3C/svg%3E) , which is exactly what the revenue is approaching in our chart:
, which is exactly what the revenue is approaching in our chart:
Figure 4
This model also explains the common phenomenon seen in new startups: Fast initial growth that tapers off sooner than the founders expected, given that the target market is still many orders of magnitude larger than the company.
The chart shows why. When “current MRR” is far away from “Max MRR,” MRR will grow quickly; without many existing customers, there’s not much churn. As customers accumulate, churn grows, and then it’s the churn that’s slowing growth, not the market. As MRR approaches Max MRR, churn becomes the dominant effect on growth.
Thus the Max MRR metric indicates not only the maximum size of the company, but the size at which growth will start slowing. Obviously we want this metric to increase over time, as we increase new revenue or decrease cancellations. How can we know where we should invest our time?
Max MRR as cancellation rate improves
In real companies, neither new MRR nor cancellation rate is constant, so Max MRR changes over time. How does that look?
Varying cancellation even by small amount yields a large difference, because cancellation is a nonlinear—exponential in fact—so small changes are magnified.
Let’s take the same company, still with a fixed $1000/mo in New MRR, starting with 7%/mo cancellation for the first 20 months, then improving to 4% over the next 10 months, then holding at 4%:

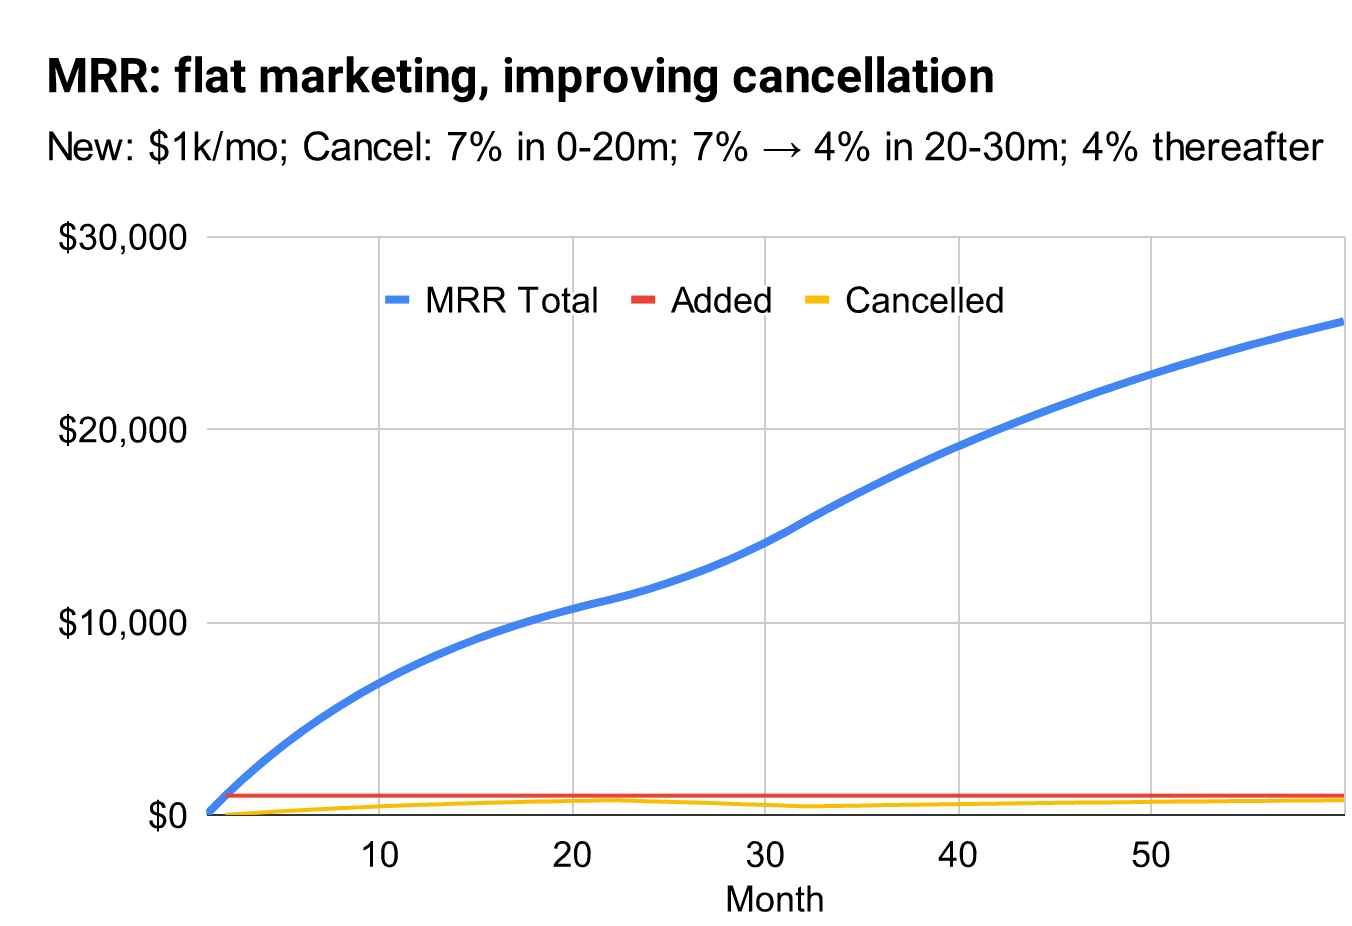
Figure 5
Notice that although cancellation changed relatively quickly, revenue doesn’t react quickly, looking mostly linear but “wavy.” It is therefore difficult to tell, looking at revenue, that we’ve made a massive improvement to the business model. In contrast, let’s also plot the “Max MRR” metric:

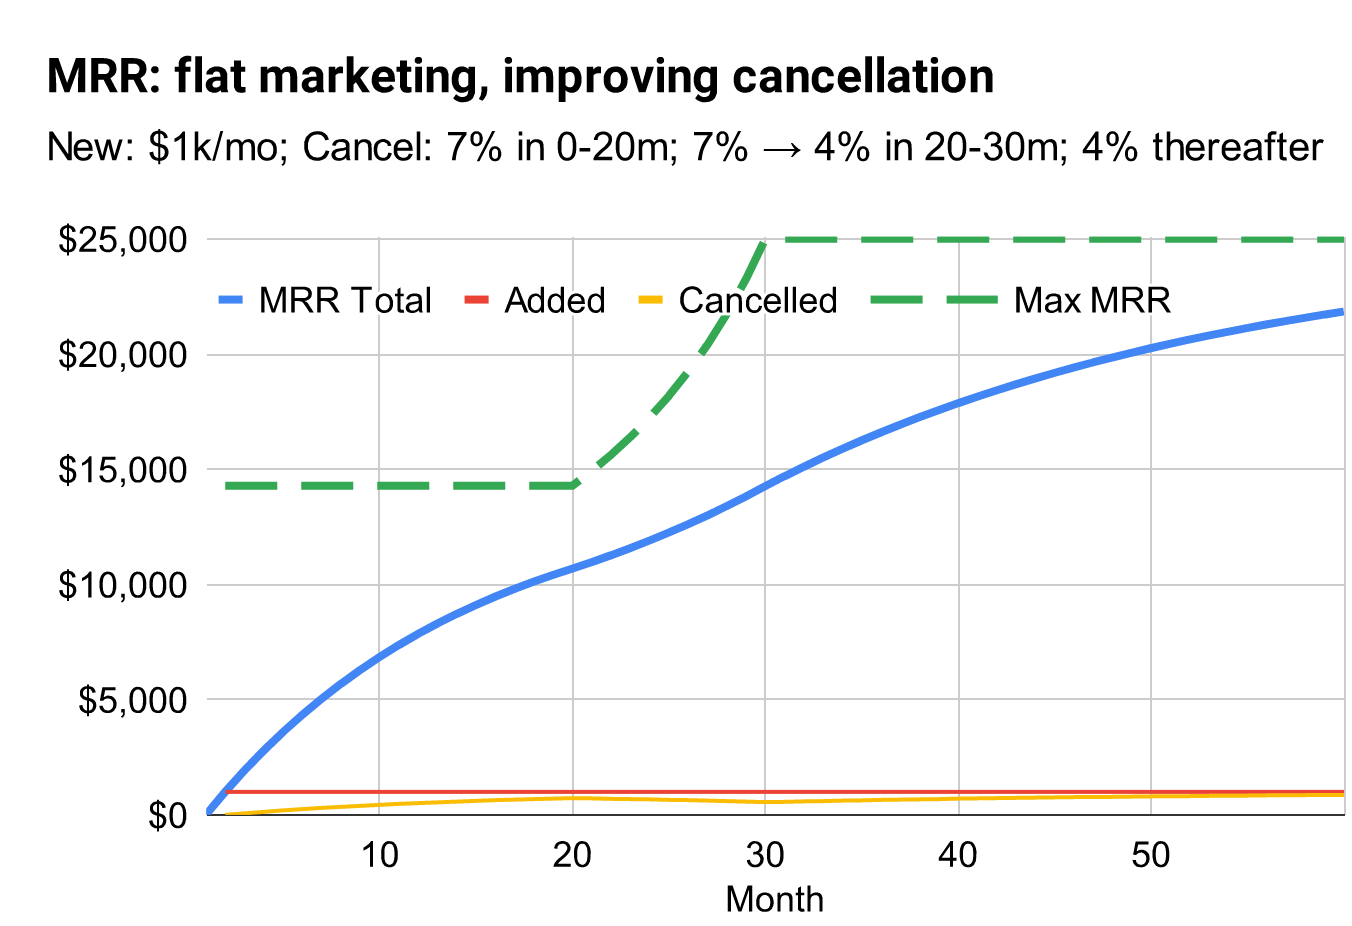
Figure 6
Notice how the “Max MRR” line shoots up as soon as cancellation rate starts improving, while MRR lags behind. When MRR gets near that ceiling, the cancellation rate dominates the (slowing) growth; when we lift the ceiling, “New MRR” becomes the dominant factor again.
“Max MRR” is therefore a leading indicator of long-term growth, because it shoots up quickly when conditions change, whereas “Current MRR” is a lagging indicator.
Max MRR as new MRR accelerates
Now let’s swap which variable is improving; we’ll fix cancellation rate back at 5%, and allow “New MRR” to increase.
We already know that if we have a steady input from marketing, growth levels out quickly. What if marketing improves?
Suppose in the first month we add $100 in MRR, in the second month we add $200, and so on, adding $100 more each month than the month before. This is accelerating revenue—growing faster and faster. And we’ll let it accelerate for 60 straight months:

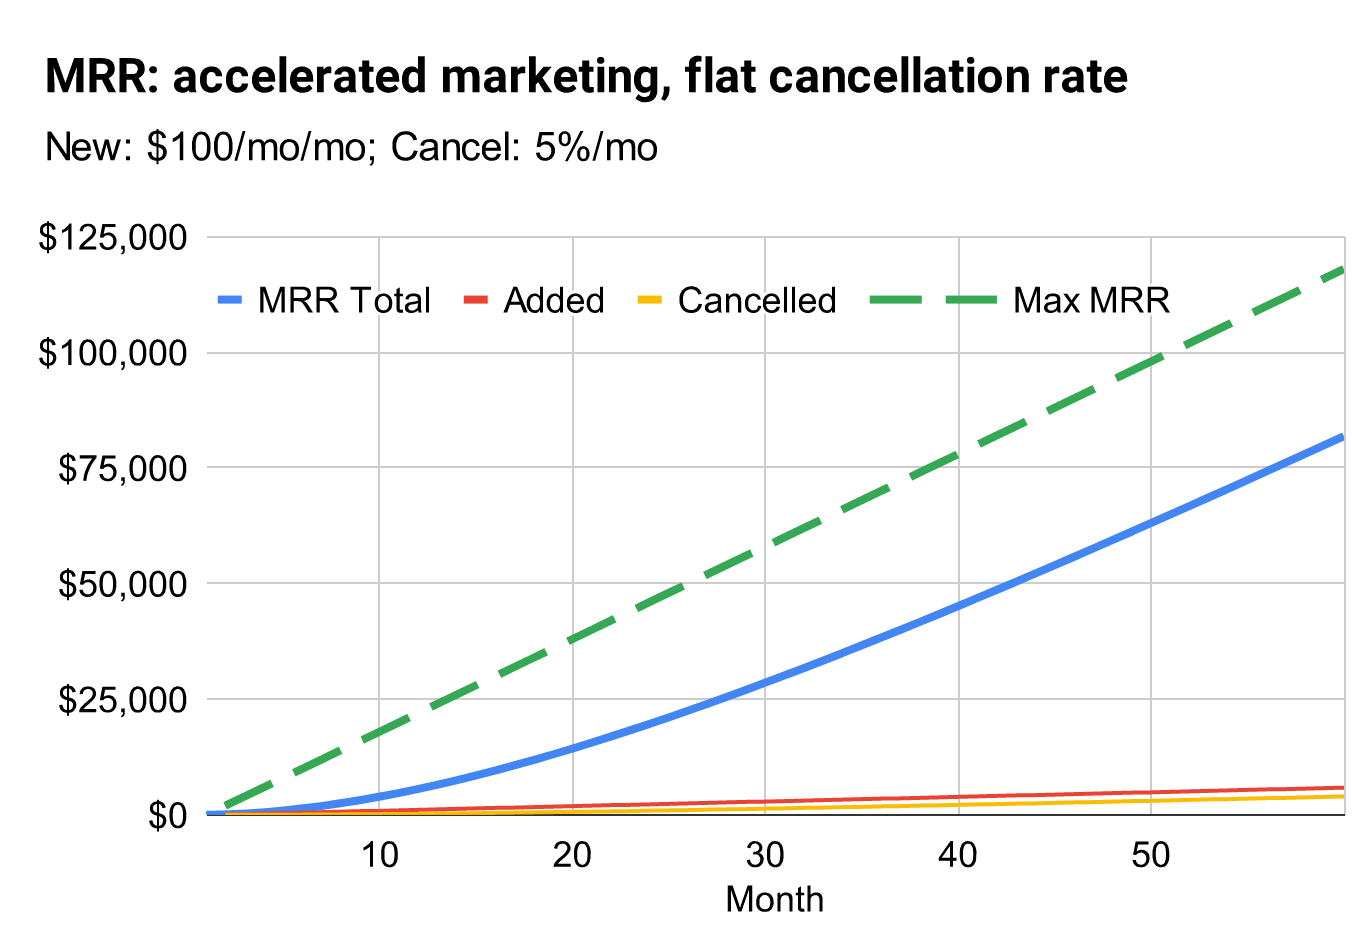
Figure 7
The first thing we notice is that growth doesn’t stop. “Max MRR” also grows alongside actual MRR.
But before we celebrate too much, realize that MRR is not accelerating. MRR is growing at more or less a constant pace—it looks like a line for most of this time frame. Yet this is a company that is accelerating their marketing output!
So this is disappointing. New MRR is accelerating, yet MRR is growing only linearly. This is once again because cancellations are exponential, which means cancellations are accelerating too. The acceleration from cancellation cancels out the acceleration from New MRR. Thus, even companies with accelerating new growth still typically grow revenue linearly, as analyzed here with many real-world examples.
Furthermore, this scenario is still too optimistic; you cannot grow a marketing channel forever. In fact, channels not only top out, but tend to decline once mature (for reasons again detailed here). In a more typical situation, the company unlocks a marketing channel but then reaches the channel’s capacity for delivering additional sales every month. This results in initially-accelerating growth, followed by the ceiling that we’ve now come to expect. Once again the Max MRR curve presages all this, and therefore is a useful leading indicator:

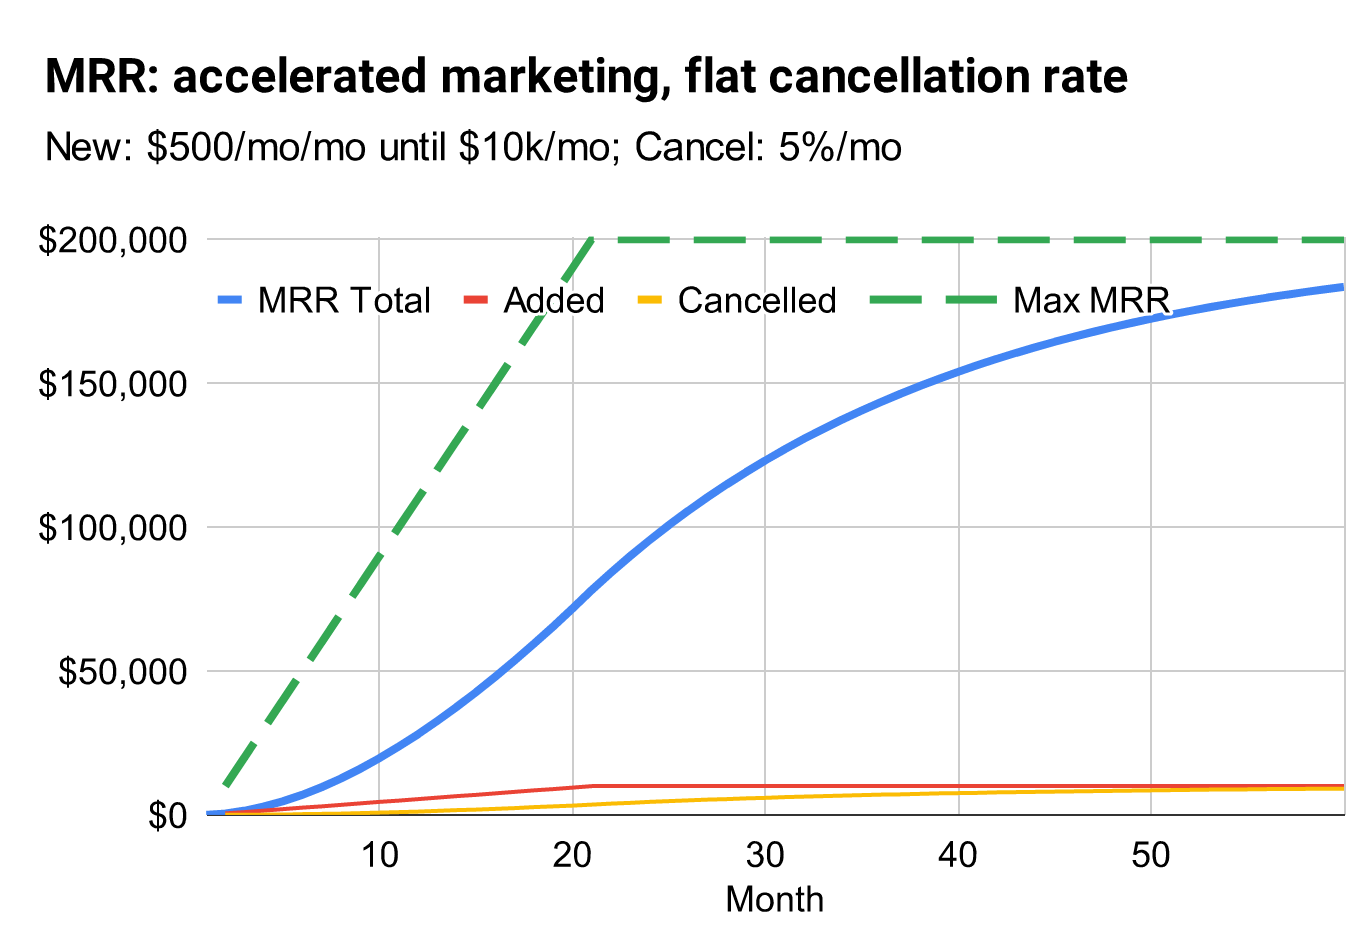
Figure 8
We also see the emergence of the classic “S-curve” revenue line. Growth accelerates during the combination of “not many customers yet who could cancel” and “new marketing channel is still growing.” When marketing effectiveness levels off, the curve switches into deceleration. This has been observed thousands of times across companies in all industries and decades.
The Max MRR curve predicts this, months or even years before it happens. This is its utility.
Now that you have a good sense of how everything works with toy models, let’s apply this in the real world.
Max MRR at Buffer
Figure 9 shows their MRR alongside Max MRR. Notice how the Max MRR line reacts immediately and ahead of revenue, anticipating both the good news and bad news.

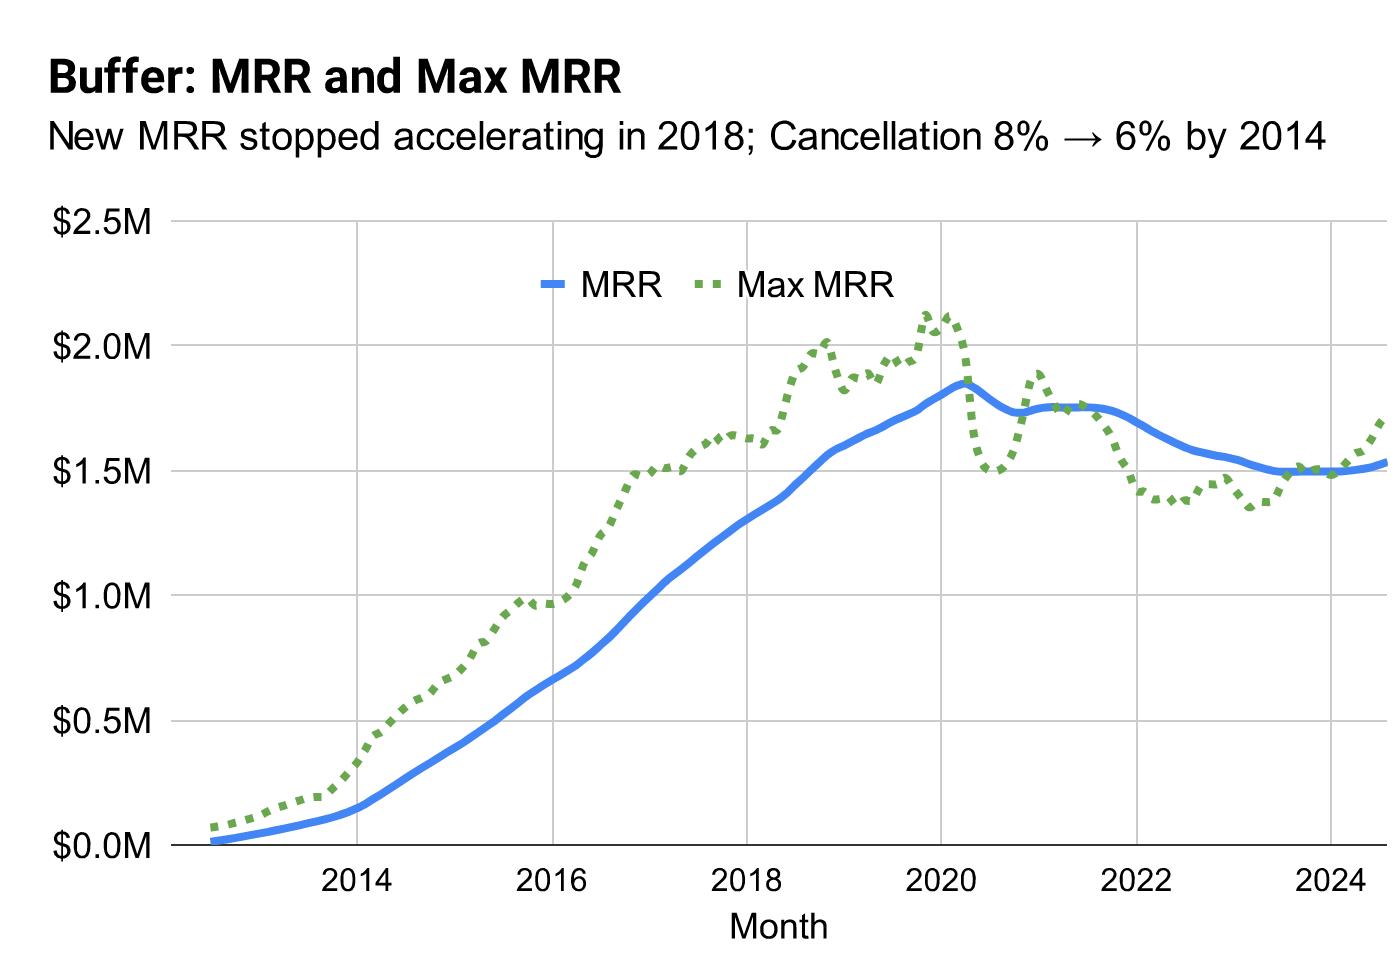
Figure 9
Buffer went through a few phases:
| Timeframe | New MRR1 & Cancels2 |
Discussion |
|---|---|---|
| 2012- 2014 |
MRR $3k → $40k Cancel 8% → 6% |
As they found Product/ |
| 2014- 2020 |
MRR $40k → $140k Cancel 6% |
Although cancellations never improved, they accelerated new MRR significantly, with a few clear “found a new channel… channel became saturated” events visible where Max MRR briefly plateaued. This maintained linear growth, but never accelerated growth, because cancellations were still high. |
| 2020- 2024 |
MRR $140k → $90k Cancel 7% |
Revenue sharply declines and struggles for years; cancellation pops up another percentage, causing the dip. New MRR is still large, but because cancellation is also large, Max MRR dips below revenue, so revenue falls. |
| 2024- | MRR $100k → $150k Cancel 6% |
New MRR substantially increased, with cancellation slightly improving, so Max MRR shoots up and growth reignites. Imagine what would happen with cancellation of 4%! |
1 Includes new customer MRR, upgrade MRR, and reactivating previously-cancelled customers.
2 Includes customer cancellations and downgrades.
Notice how the Max MRR line reacts much quicker, and with much larger magnitude, than any other metric. Anticipating both the good news and bad news.
Looking at the components of Max MRR, the most impactful culprit is the high cancellation rate. 6% is precarious, requiring forever-accelerating new MRR, and quickly tanking revenue as soon as new MRR didn’t keep up, which of course it inevitably cannot.
What if Buffer had focused on customer retention, shifting the cancellation rate over five years from 8% in 2014 to 3% by 2019? Then revenue would have doubled:

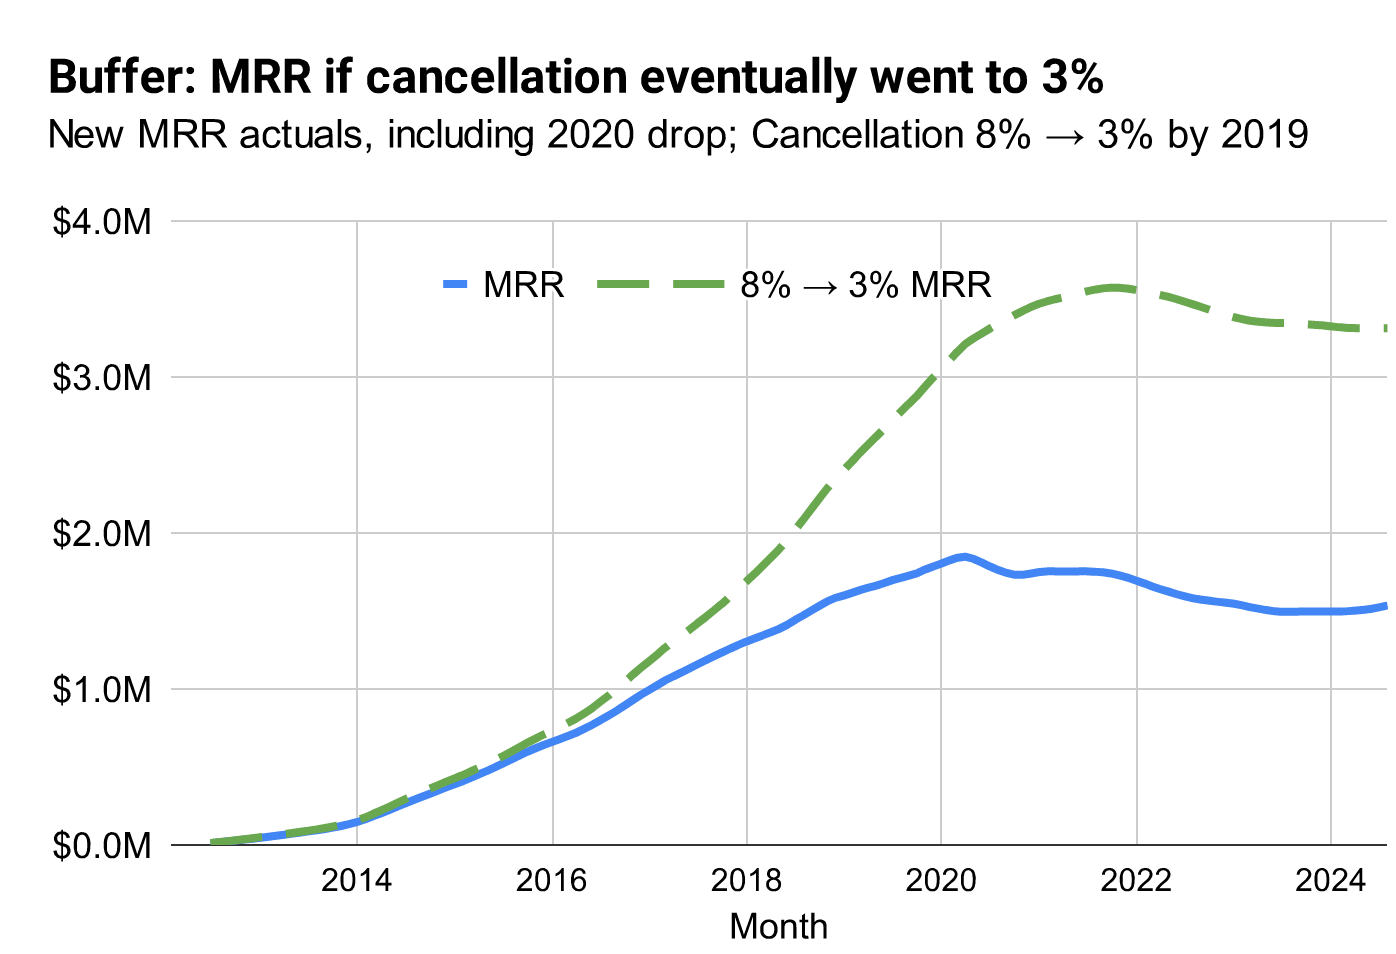
Figure 10
Of course this is easy to predict knowing how Max MRR works. If you halve the cancellation rate, you double Max MRR. In 2023, Buffer founder and CEO Joel Gascoigne wrote a strategy letter saying the same thing. He shifted the corporate strategy back to their ideal customer inside their best target market (entrepreneurs and small businesses), back to a pricing model that worked better for them (freemium), who therefore retain at higher rates. And it worked—we can see cancellation diminish, MRR increase, and Max MRR increase ahead of MRR.
Max MRR vs NRR
NRR is Net Revenue Retention, which answers the question: If no new customers were added, how would revenue change over the course of a year, as a percentage of the ARR from the start of that year? Specifically, and converting from MRR to ARR:
%22%3E%3Cg%20data-mml-node=%22math%22%3E%3Cg%20data-mml-node=%22mstyle%22%3E%3Cg%20data-mml-node=%22TeXAtom%22%20data-mjx-texclass=%22ORD%22%3E%3Cg%20data-mml-node=%22mtext%22%3E%3Cpath%20data-c=%224E%22%20d=%22M42%2046q32%202%2052%2010t24%2013%2010%2017V634h-4q-10%203-72%203H25v46H232l3-3q2-1%2087-126T493%20303l85-125V598q-6%2010-10%2015t-24%2014-52%2010H475v46h8q15-3%20117-3%20106%200%20115%203h9V637H707q-73-4-85-39l-1-296V6l-7-6H6e2q-15%200-18%203T481%20150%20282%20443%20171%20605V345l1-259q11-36%2085-40h17V0h-9Q250%203%20150%203%2048%203%2033%200H25V46H42z%22/%3E%3Cpath%20data-c=%2252%22%20d=%22M130%20622q-7%207-11%209t-16%203-43%203H27v46H202h34%2064q76%200%20117-6t83-29q95-48%20109-131%201-5%201-16%200-33-16-62t-38-47-45-31-39-18l-16-5q3-3%2011-6%2030-16%2049-34t29-44%2014-43%209-56%2010-61q10-48%2024-63t38-15h5q15%200%2029%2016t18%2055q0%2011%204%2014t16%204%2016-2%204-13q0-31-16-63T672-16q-16-6-42-6Q481-16%20458%2090q-2%2011-2%2073t-7%2083q-19%2058-76%2074l-10%202-66%201H231V192l1-131q6-10%2017-12t52-3h33V0H323Q302%203%20181%203%2059%203%2038%200H27V46H60q42%201%2051%203t19%2012V622zM491%20499v10q0%2018-1%2030t-9%2031-19%2031-38%2022-62%2013q-2%200-22%200t-36%201H283q-45%200-49-9-3-4-3-136V360h58q101%200%20145%2018t55%2078q2%2011%202%2043z%22%20transform=%22translate(750,0)%22/%3E%3Cpath%20data-c=%2252%22%20d=%22M130%20622q-7%207-11%209t-16%203-43%203H27v46H202h34%2064q76%200%20117-6t83-29q95-48%20109-131%201-5%201-16%200-33-16-62t-38-47-45-31-39-18l-16-5q3-3%2011-6%2030-16%2049-34t29-44%2014-43%209-56%2010-61q10-48%2024-63t38-15h5q15%200%2029%2016t18%2055q0%2011%204%2014t16%204%2016-2%204-13q0-31-16-63T672-16q-16-6-42-6Q481-16%20458%2090q-2%2011-2%2073t-7%2083q-19%2058-76%2074l-10%202-66%201H231V192l1-131q6-10%2017-12t52-3h33V0H323Q302%203%20181%203%2059%203%2038%200H27V46H60q42%201%2051%203t19%2012V622zM491%20499v10q0%2018-1%2030t-9%2031-19%2031-38%2022-62%2013q-2%200-22%200t-36%201H283q-45%200-49-9-3-4-3-136V360h58q101%200%20145%2018t55%2078q2%2011%202%2043z%22%20transform=%22translate(1486,0)%22/%3E%3C/g%3E%3Cg%20data-mml-node=%22mo%22%20transform=%22translate(2499.8,0)%22%3E%3Cpath%20data-c=%223D%22%20d=%22M56%20347q0%2013%2014%2020H707q15-8%2015-20%200-11-14-19l-318-1H72q-16%205-16%2020zm0-194q0%2015%2016%2020H708q14-10%2014-20%200-13-15-20H70q-14%207-14%2020z%22/%3E%3C/g%3E%3Cg%20data-mml-node=%22mstyle%22%20transform=%22translate(3555.6,0)%22%3E%3Cg%20data-mml-node=%22mfrac%22%3E%3Cg%20data-mml-node=%22mrow%22%20transform=%22translate(220,676)%22%3E%3Cg%20data-mml-node=%22mtext%22%3E%3Cpath%20data-c=%2255%22%20d=%22M128%20622q-7%207-11%209t-16%203-43%203H25v46H36q21-3%20144-3%20135%200%20144%203h11V637H302q-40-1-51-3t-18-12l-1-204V291q0-102%208-146t40-78q45-43%20109-43%2065%200%20117%2040t65%20119q4%2023%204%20227V598q-6%2010-10%2015t-24%2014-52%2010H472v46h9q15-3%20117-3t117%203h9V637H707q-73-4-85-39l-1-199q-1-205-4-219%200-1-2-9-20-88-84-140T389-22q-85%200-163%2055T130%20192q-1%209-2%20220V622z%22/%3E%3Cpath%20data-c=%2270%22%20d=%22M36-148H50q39%200%2047%2014v8q0%207%200%2019t0%2030%201%2039T98%206t0%2049%200%2051q0%2034%200%2071t0%2066%200%2053-1%2039%200%2016q-3%2019-14%2025t-45%209H20v23q0%2023%202%2023l10%201q10%201%2029%202t37%202q17%201%2037%202t30%203%2011%201h3V416l1-26%208%207q59%2044%20138%2044%2081%200%20138-64t58-161q0-101-65-164T310-11q-68%200-120%2044l-8%207V-45-101q0-27%202-33t11-11q21-3%2049-3h16v-46h-8l-24%201q-23%201-50%201t-38%201q-103%200-112-3H20v46H36zM424%20218q0%2074-34%20129t-85%2055q-71%200-123-65V98q40-72%20112-72%2051%200%2090%2054t40%20138z%22%20transform=%22translate(750,0)%22/%3E%3Cpath%20data-c=%2267%22%20d=%22M329%20409q44%2044%201e2%2044%2030%200%2043-19t13-38q0-14-9-25t-27-11q-33%200-37%2030-2%2014%203%2021%200%201%201%203v1q-28-3-53-22-8-5-8-7%200-1%204-5t9-12%2011-18%209-26%204-33q0-62-49-105T222%20143q-50%200-99%2028-11-18-11-38%200-35%2026-52%209-6%2017-6t72-2q84-1%20108-6%2061-9%2096-41%2039-39%2039-98%200-67-78-103-60-31-142-31-83%200-143%2031Q29-140%2029-75q0%2036%2021%2060T92%2018l11%206Q67%2055%2067%20108q0%2047%2029%2085-44%2044-44%2099%200%2063%2050%20106t121%2044q51%200%2095-26l11-7zm-30-66q-5%2028-26%2044t-52%2017q-29%200-50-16t-26-45q-3-17-3-51%200-44%207-65t30-35q17-10%2043-10%2022%200%2038%207t23%2018%2011%2020%205%2015q3%2016%203%2050t-3%2051zM403-75q0%2025-14%2041T348-11%20299-2%20245%200H218q-67%200-80-6-20-9-31-28T95-74q0-10%206-23t21-30%2048-28%2080-12q69%200%20111%2028t42%2064z%22%20transform=%22translate(1306,0)%22/%3E%3Cpath%20data-c=%2272%22%20d=%22M36%2046H50q39%200%2047%2014v8q0%209%200%2023t1%2031%200%2039%200%2042q0%2031%200%2066t0%2059l-1%2023q-3%2019-14%2025t-45%209H20v23q0%2023%202%2023l10%201q10%201%2028%202t36%202q16%201%2035%202t29%203%2011%201h3V373q39%2068%2097%2068h6q45%200%2066-22t21-46q0-21-13-36t-38-15-37%2016-13%2034q0%209%202%2016t5%2012%203%205q-2%202-23-4-16-8-24-15-47-45-47-179V154q0-13%200-27t0-26%201-20%200-15V61q1-2%203-4t5-3%205-3%207-2%207-1%209-1%209%200%2010-1%2010%200h31V0h-9Q249%203%20140%203%2037%203%2028%200H20V46H36z%22%20transform=%22translate(1806,0)%22/%3E%3Cpath%20data-c=%2261%22%20d=%22M137%20305t-22%200-37%2015-15%2039q0%2035%2034%2062t121%2027q73%200%20118-32t60-76q5-14%205-31t1-115V124q0-48%205-66t21-18q15%200%2020%2016t5%2053v36h40V106q-1-40-3-47-9-30-35-47T4e2-6%20353%2012%20329%2054v4l-2-3q-2-3-5-6t-8-9-12-11-15-12T269%206%20247-2%20221-8t-31-3Q130-11%2082%2020T34%20107q0%2021%207%2040t27%2041%2048%2037%2078%2028%20110%2015h14v22q0%2034-6%2050-22%2071-97%2071-18%200-34-1t-25-4-8-3q22-15%2022-44%200-25-16-39zM126%20106q0-31%2024-55t59-25q38%200%2067%2023t39%2060q2%207%203%2066%200%2058-1%2058-8%200-21-1t-45-9-58-20-46-37-21-60z%22%20transform=%22translate(2198,0)%22/%3E%3Cpath%20data-c=%2264%22%20d=%22M376%20495q0%2016%200%2040t1%2033q0%2045-10%2056t-51%2013H298v23q0%2023%202%2023l10%201q10%201%2029%202t37%202q17%201%2037%202t30%203%2011%201h3V390q0-306%201-309%203-20%2014-26t45-9h18V0q-2%200-76-5t-79-6h-7V44l-8-7Q307-11%20235-11%20158-11%2096%2050T34%20215q0%201e2%2063%20163t147%2064q75%200%20132-49V495zm-3-153q-45%2063-113%2063-49%200-87-36-27-28-34-64t-8-94q0-56%207-91t35-61q30-33%2078-33%2071%200%20122%2077V342z%22%20transform=%22translate(2698,0)%22/%3E%3Cpath%20data-c=%2265%22%20d=%22M28%20218q0%2055%2020%201e2t50%2073%2065%2042%2066%2015q53%200%2091-18t58-50%2028-64%209-71q0-7-7-14H126V216Q126%2068%20226%2036q20-6%2044-6%2042%200%2072%2032%2017%2017%2027%2042l10%2024q3%203%2016%203h3q17%200%2017-10%200-4-3-13-19-55-63-87T250-11Q155-11%2092%2058T28%20218zm305%2057q-11%20128-95%20136h-2q-8%200-16-1t-25-8-29-21-23-41-16-66v-7H333v8z%22%20transform=%22translate(3254,0)%22/%3E%3C/g%3E%3Cg%20data-mml-node=%22mo%22%20transform=%22translate(3920.2,0)%22%3E%3Cpath%20data-c=%222212%22%20d=%22M84%20237t0%2013%2014%2020H679q15-8%2015-20t-15-20H98q-14%207-14%2020z%22/%3E%3C/g%3E%3Cg%20data-mml-node=%22mtext%22%20transform=%22translate(4920.4,0)%22%3E%3Cpath%20data-c=%2244%22%20d=%22M130%20622q-7%207-11%209t-16%203-43%203H27v46H228q171-1%20191-1t42-6q43-9%2085-35t80-68%2059-103%2023-134q0-126-74-220T442%203Q429%201%20228%200H27V46H60q42%201%2051%203t19%2012V622zM593%20338q0%20101-22%20163T493%20602q-54%2035-138%2035H322%20294q-56%200-60-9-3-4-3-284%200-282%201-285%201-10%2016-11t91-2h11q106%200%20165%2049%2046%2038%2062%2096t16%20147z%22/%3E%3Cpath%20data-c=%226F%22%20d=%22M28%20214q0%2095%2065%20164t157%2070q90%200%20155-68t66-165q0-95-64-160T250-10Q153-10%2091%2057T28%20214zM250%2030q122%200%20122%20163v32%2025q0%2022-1%2038t-7%2038-16%2036-31%2028-49%2020q-5%201-16%201-30%200-57-12-43-22-56-61t-13-92V226q0-96%2019-135%2032-61%20105-61z%22%20transform=%22translate(764,0)%22/%3E%3Cpath%20data-c=%2277%22%20d=%22M90%20368q-6%2010-14%2012t-36%205H18v46h6l19-1q19%200%2041-1t32-1q90%200%20105%203h8V385H215q-38-2-38-17%200-1%2044-129l44-126%2074%20215-6%2017q-10%2029-17%2034-8%205-38%206H258v46h6q6-3%2084-3%2091%200%20106%203h7V385h-9q-48%200-48-16%200-3%2014-45t31-90%2032-91l15-43%2041%20119q42%20122%2042%20128%200%2016-15%2026t-34%2012h-8v46h7q12-3%2095-3%2068%200%2074%203h5V385h-6q-1%200-6%200t-9-1q-47-7-63-50L559%20161q-13-37-31-90-20-59-25-70T487-11h-8q-19%200-23%207-1%201-49%20137L361%20267q-2-4-95-271-5-7-23-7h-5q-13%200-18%208L90%20368z%22%20transform=%22translate(1264,0)%22/%3E%3Cpath%20data-c=%226E%22%20d=%22M41%2046H55q39%200%2047%2014v8q0%209%200%2023t0%2031%201%2039%200%2042q0%2031%200%2066t-1%2059v23q-3%2019-14%2025t-45%209H25v23q0%2023%202%2023l10%201q10%201%2028%202t37%202q17%201%2036%202t29%203%2011%201h3V402q0-38%201-38t5%205%2012%2015%2019%2018%2029%2019%2038%2016%2051%205q114-4%20127-113%201-7%201-139V104q0-38%202-45t11-10q21-3%2049-3h16V0h-8L510%201q-23%201-50%201T422%203Q319%203%20310%200h-8V46h16q61%200%2061%2016%201%202%201%20138-1%20135-2%20143-6%2028-20%2042t-24%2017-26%202q-45%200-79-34-27-27-34-55t-8-83V168%20108q0-30%201-40t3-13%209-6q21-3%2049-3h16V0h-8L234%201q-24%201-51%201T145%203Q42%203%2033%200H25V46H41z%22%20transform=%22translate(1986,0)%22/%3E%3Cpath%20data-c=%2267%22%20d=%22M329%20409q44%2044%201e2%2044%2030%200%2043-19t13-38q0-14-9-25t-27-11q-33%200-37%2030-2%2014%203%2021%200%201%201%203v1q-28-3-53-22-8-5-8-7%200-1%204-5t9-12%2011-18%209-26%204-33q0-62-49-105T222%20143q-50%200-99%2028-11-18-11-38%200-35%2026-52%209-6%2017-6t72-2q84-1%20108-6%2061-9%2096-41%2039-39%2039-98%200-67-78-103-60-31-142-31-83%200-143%2031Q29-140%2029-75q0%2036%2021%2060T92%2018l11%206Q67%2055%2067%20108q0%2047%2029%2085-44%2044-44%2099%200%2063%2050%20106t121%2044q51%200%2095-26l11-7zm-30-66q-5%2028-26%2044t-52%2017q-29%200-50-16t-26-45q-3-17-3-51%200-44%207-65t30-35q17-10%2043-10%2022%200%2038%207t23%2018%2011%2020%205%2015q3%2016%203%2050t-3%2051zM403-75q0%2025-14%2041T348-11%20299-2%20245%200H218q-67%200-80-6-20-9-31-28T95-74q0-10%206-23t21-30%2048-28%2080-12q69%200%20111%2028t42%2064z%22%20transform=%22translate(2542,0)%22/%3E%3Cpath%20data-c=%2272%22%20d=%22M36%2046H50q39%200%2047%2014v8q0%209%200%2023t1%2031%200%2039%200%2042q0%2031%200%2066t0%2059l-1%2023q-3%2019-14%2025t-45%209H20v23q0%2023%202%2023l10%201q10%201%2028%202t36%202q16%201%2035%202t29%203%2011%201h3V373q39%2068%2097%2068h6q45%200%2066-22t21-46q0-21-13-36t-38-15-37%2016-13%2034q0%209%202%2016t5%2012%203%205q-2%202-23-4-16-8-24-15-47-45-47-179V154q0-13%200-27t0-26%201-20%200-15V61q1-2%203-4t5-3%205-3%207-2%207-1%209-1%209%200%2010-1%2010%200h31V0h-9Q249%203%20140%203%2037%203%2028%200H20V46H36z%22%20transform=%22translate(3042,0)%22/%3E%3Cpath%20data-c=%2261%22%20d=%22M137%20305t-22%200-37%2015-15%2039q0%2035%2034%2062t121%2027q73%200%20118-32t60-76q5-14%205-31t1-115V124q0-48%205-66t21-18q15%200%2020%2016t5%2053v36h40V106q-1-40-3-47-9-30-35-47T4e2-6%20353%2012%20329%2054v4l-2-3q-2-3-5-6t-8-9-12-11-15-12T269%206%20247-2%20221-8t-31-3Q130-11%2082%2020T34%20107q0%2021%207%2040t27%2041%2048%2037%2078%2028%20110%2015h14v22q0%2034-6%2050-22%2071-97%2071-18%200-34-1t-25-4-8-3q22-15%2022-44%200-25-16-39zM126%20106q0-31%2024-55t59-25q38%200%2067%2023t39%2060q2%207%203%2066%200%2058-1%2058-8%200-21-1t-45-9-58-20-46-37-21-60z%22%20transform=%22translate(3434,0)%22/%3E%3Cpath%20data-c=%2264%22%20d=%22M376%20495q0%2016%200%2040t1%2033q0%2045-10%2056t-51%2013H298v23q0%2023%202%2023l10%201q10%201%2029%202t37%202q17%201%2037%202t30%203%2011%201h3V390q0-306%201-309%203-20%2014-26t45-9h18V0q-2%200-76-5t-79-6h-7V44l-8-7Q307-11%20235-11%20158-11%2096%2050T34%20215q0%201e2%2063%20163t147%2064q75%200%20132-49V495zm-3-153q-45%2063-113%2063-49%200-87-36-27-28-34-64t-8-94q0-56%207-91t35-61q30-33%2078-33%2071%200%20122%2077V342z%22%20transform=%22translate(3934,0)%22/%3E%3Cpath%20data-c=%2265%22%20d=%22M28%20218q0%2055%2020%201e2t50%2073%2065%2042%2066%2015q53%200%2091-18t58-50%2028-64%209-71q0-7-7-14H126V216Q126%2068%20226%2036q20-6%2044-6%2042%200%2072%2032%2017%2017%2027%2042l10%2024q3%203%2016%203h3q17%200%2017-10%200-4-3-13-19-55-63-87T250-11Q155-11%2092%2058T28%20218zm305%2057q-11%20128-95%20136h-2q-8%200-16-1t-25-8-29-21-23-41-16-66v-7H333v8z%22%20transform=%22translate(4490,0)%22/%3E%3C/g%3E%3Cg%20data-mml-node=%22mo%22%20transform=%22translate(10076.7,0)%22%3E%3Cpath%20data-c=%222212%22%20d=%22M84%20237t0%2013%2014%2020H679q15-8%2015-20t-15-20H98q-14%207-14%2020z%22/%3E%3C/g%3E%3Cg%20data-mml-node=%22mtext%22%20transform=%22translate(11076.9,0)%22%3E%3Cpath%20data-c=%2243%22%20d=%22M56%20342q0%2086%2033%20158t85%20115%20109%2066%20108%2024q3%200%209%200t8-1q91%200%20161-68l13-12%2030%2039q27%2037%2031%2041%201%200%204%200t6%201h4q3%200%209-6V419l-6-6H626q-6%206-7%2017-9%2082-48%20142t-95%2079q-19%207-50%207-104%200-174-70-79-79-79-246%200-121%2038-191%2021-40%2052-67t65-39%2056-16%2044-5q89%200%20143%2069t55%20151q0%207%206%2013h28l6-6V236q-5-103-76-180T403-21Q262-21%20159%2083T56%20342z%22/%3E%3Cpath%20data-c=%2261%22%20d=%22M137%20305t-22%200-37%2015-15%2039q0%2035%2034%2062t121%2027q73%200%20118-32t60-76q5-14%205-31t1-115V124q0-48%205-66t21-18q15%200%2020%2016t5%2053v36h40V106q-1-40-3-47-9-30-35-47T4e2-6%20353%2012%20329%2054v4l-2-3q-2-3-5-6t-8-9-12-11-15-12T269%206%20247-2%20221-8t-31-3Q130-11%2082%2020T34%20107q0%2021%207%2040t27%2041%2048%2037%2078%2028%20110%2015h14v22q0%2034-6%2050-22%2071-97%2071-18%200-34-1t-25-4-8-3q22-15%2022-44%200-25-16-39zM126%20106q0-31%2024-55t59-25q38%200%2067%2023t39%2060q2%207%203%2066%200%2058-1%2058-8%200-21-1t-45-9-58-20-46-37-21-60z%22%20transform=%22translate(722,0)%22/%3E%3Cpath%20data-c=%226E%22%20d=%22M41%2046H55q39%200%2047%2014v8q0%209%200%2023t0%2031%201%2039%200%2042q0%2031%200%2066t-1%2059v23q-3%2019-14%2025t-45%209H25v23q0%2023%202%2023l10%201q10%201%2028%202t37%202q17%201%2036%202t29%203%2011%201h3V402q0-38%201-38t5%205%2012%2015%2019%2018%2029%2019%2038%2016%2051%205q114-4%20127-113%201-7%201-139V104q0-38%202-45t11-10q21-3%2049-3h16V0h-8L510%201q-23%201-50%201T422%203Q319%203%20310%200h-8V46h16q61%200%2061%2016%201%202%201%20138-1%20135-2%20143-6%2028-20%2042t-24%2017-26%202q-45%200-79-34-27-27-34-55t-8-83V168%20108q0-30%201-40t3-13%209-6q21-3%2049-3h16V0h-8L234%201q-24%201-51%201T145%203Q42%203%2033%200H25V46H41z%22%20transform=%22translate(1222,0)%22/%3E%3Cpath%20data-c=%2263%22%20d=%22M370%20305t-21%200-36%2015-16%2038q0%2023%2015%2038%205%205%205%206t-10%202q-26%204-49%204-49%200-80-32-47-47-47-157%200-82%2031-129%2041-61%20110-61%2041%200%2066%2026t36%2062q2%208%205%2010t16%202h14q6-6%206-9%200-4-4-16T395%2071%20366%2033%20318%202%20249-11Q163-11%2099%2053T34%20214q0%20104%2065%20169t151%2065%20120-27%2034-64q0-23-17-37z%22%20transform=%22translate(1778,0)%22/%3E%3Cpath%20data-c=%2265%22%20d=%22M28%20218q0%2055%2020%201e2t50%2073%2065%2042%2066%2015q53%200%2091-18t58-50%2028-64%209-71q0-7-7-14H126V216Q126%2068%20226%2036q20-6%2044-6%2042%200%2072%2032%2017%2017%2027%2042l10%2024q3%203%2016%203h3q17%200%2017-10%200-4-3-13-19-55-63-87T250-11Q155-11%2092%2058T28%20218zm305%2057q-11%20128-95%20136h-2q-8%200-16-1t-25-8-29-21-23-41-16-66v-7H333v8z%22%20transform=%22translate(2222,0)%22/%3E%3Cpath%20data-c=%226C%22%20d=%22M42%2046H56q39%200%2047%2014v8q0%209%200%2023t0%2033%201%2043%200%2050%200%2055%200%2057q0%2037%200%2078t0%2075%200%2060-1%2044%200%2017q-3%2019-14%2025t-45%209H26v23q0%2023%202%2023l10%201q10%201%2029%202t37%202q17%201%2037%202t30%203%2011%201h3V379q0-317%201-319%204-8%2012-11%2021-3%2049-3h16V0h-8L232%201q-23%201-49%201T145%203%20107%203%2057%201L34%200H26V46H42z%22%20transform=%22translate(2666,0)%22/%3E%3C/g%3E%3C/g%3E%3Cg%20data-mml-node=%22mtext%22%20transform=%22translate(6035.9,-686)%22%3E%3Cpath%20data-c=%224D%22%20d=%22M132%20622q-7%207-11%209t-16%203-43%203H29v46H135q86%200%2097-1t17-7q1-1%20105-277L458%20124%20562%20398Q666%20674%20668%20675q3%206%2015%207t98%201H887V637H854q-40-1-51-3t-18-12V61q6-10%2017-12t52-3h33V0H876Q855%203%20736%203%20605%203%20596%200H585V46h33q42%201%2051%203t19%2012V347q0%2077%200%20114t0%2085%200%2067l-1%2019Q454%2014%20450%207q-4-6-20-6T410%207q-1%202-118%20309L176%20624V606q-1-18-1-63t0-80%200-107l1-270q11-36%2085-40h17V0h-9Q254%203%20154%203%2052%203%2037%200H29V46H46q32%202%2052%2010t24%2013%2010%2017V622z%22/%3E%3Cpath%20data-c=%2252%22%20d=%22M130%20622q-7%207-11%209t-16%203-43%203H27v46H202h34%2064q76%200%20117-6t83-29q95-48%20109-131%201-5%201-16%200-33-16-62t-38-47-45-31-39-18l-16-5q3-3%2011-6%2030-16%2049-34t29-44%2014-43%209-56%2010-61q10-48%2024-63t38-15h5q15%200%2029%2016t18%2055q0%2011%204%2014t16%204%2016-2%204-13q0-31-16-63T672-16q-16-6-42-6Q481-16%20458%2090q-2%2011-2%2073t-7%2083q-19%2058-76%2074l-10%202-66%201H231V192l1-131q6-10%2017-12t52-3h33V0H323Q302%203%20181%203%2059%203%2038%200H27V46H60q42%201%2051%203t19%2012V622zM491%20499v10q0%2018-1%2030t-9%2031-19%2031-38%2022-62%2013q-2%200-22%200t-36%201H283q-45%200-49-9-3-4-3-136V360h58q101%200%20145%2018t55%2078q2%2011%202%2043z%22%20transform=%22translate(917,0)%22/%3E%3Cpath%20data-c=%2252%22%20d=%22M130%20622q-7%207-11%209t-16%203-43%203H27v46H202h34%2064q76%200%20117-6t83-29q95-48%20109-131%201-5%201-16%200-33-16-62t-38-47-45-31-39-18l-16-5q3-3%2011-6%2030-16%2049-34t29-44%2014-43%209-56%2010-61q10-48%2024-63t38-15h5q15%200%2029%2016t18%2055q0%2011%204%2014t16%204%2016-2%204-13q0-31-16-63T672-16q-16-6-42-6Q481-16%20458%2090q-2%2011-2%2073t-7%2083q-19%2058-76%2074l-10%202-66%201H231V192l1-131q6-10%2017-12t52-3h33V0H323Q302%203%20181%203%2059%203%2038%200H27V46H60q42%201%2051%203t19%2012V622zM491%20499v10q0%2018-1%2030t-9%2031-19%2031-38%2022-62%2013q-2%200-22%200t-36%201H283q-45%200-49-9-3-4-3-136V360h58q101%200%20145%2018t55%2078q2%2011%202%2043z%22%20transform=%22translate(1653,0)%22/%3E%3C/g%3E%3Crect%20width=%2214220.9%22%20height=%2260%22%20x=%22120%22%20y=%22220%22/%3E%3C/g%3E%3C/g%3E%3Cg%20data-mml-node=%22mo%22%20transform=%22translate(18238.7,0)%22%3E%3Cpath%20data-c=%22D7%22%20d=%22M630%2029q0-20-21-20-5%200-22%2016t-94%2093L389%20222%20284%20117Q178%2013%20175%2011q-4-2-7-2-8%200-14%206t-7%2014q0%207%2014%2022t94%2095L359%20250%20255%20354q-81%2081-94%2095t-14%2022q0%209%206%2014t15%205q5%200%207-1%203-2%20109-106L389%20278%20493%20382q77%2077%2094%2093t22%2016q21%200%2021-20%200-7-10-18t-98-98L418%20250%20522%20145q84-84%2096-97t12-19z%22/%3E%3C/g%3E%3Cg%20data-mml-node=%22mn%22%20transform=%22translate(19238.9,0)%22%3E%3Cpath%20data-c=%2231%22%20d=%22M213%20578l-13-5q-14-5-40-10t-58-7H83v46h19q47%202%2087%2015t56%2024%2028%2022q2%203%2012%203%209%200%2017-6V361l1-3e2q7-7%2012-9t24-4%2062-2h26V0H416Q395%203%20257%203%20121%203%201e2.0H88V46h26q22%200%2038%200t25%201%2016%203%208%202%206%205%206%204V578z%22/%3E%3Cpath%20data-c=%2232%22%20d=%22M109%20429q-27%200-43%2018T50%20491q0%2071%2053%20123t132%2052q91%200%20152-56t62-145q0-43-20-82t-48-68-80-74q-36-31-1e2-92L142%2093l76-1q157%200%20167%205%207%202%2024%2089v3h40v-3q-1-3-13-91T421%203V0H50V19%2031q0%207%206%2015T86%2081q29%2032%2050%2056%209%2010%2034%2037t34%2037%2029%2033%2028%2034%2023%2030%2021%2032%2015%2029%2013%2032%207%2030%203%2033q0%2063-34%20109t-97%2046q-33%200-58-17t-35-33-10-19q0-1%205-1%2018%200%2037-14t19-46q0-25-16-42t-45-18z%22%20transform=%22translate(500,0)%22/%3E%3C/g%3E%3C/g%3E%3C/g%3E%3C/g%3E%3C/g%3E%3C/svg%3E)
When upgrades exceed cancellations and downgrades, revenue grows every month, even when you’re not adding new customers. At what point would revenue top out in that scenario?
If the market were infinite, you would never stop growing! Therefore “Max MRR” ceases to have meaning.
Of course, markets are not infinite, just as marketing channels are not infinite, so you will top out anyway, but not because of the factors that go into Max MRR. Rather, it will be because you’ll have reached saturation in your target market.
This demonstrates a simple point: After high retention, the most powerful growth lever is to have NRR ≥ 100%. Indeed, almost all public SaaS companies have NRR ≥ 100%, exactly because if they didn’t, their Max NRR ceiling would be too low for their lofty revenue goals:

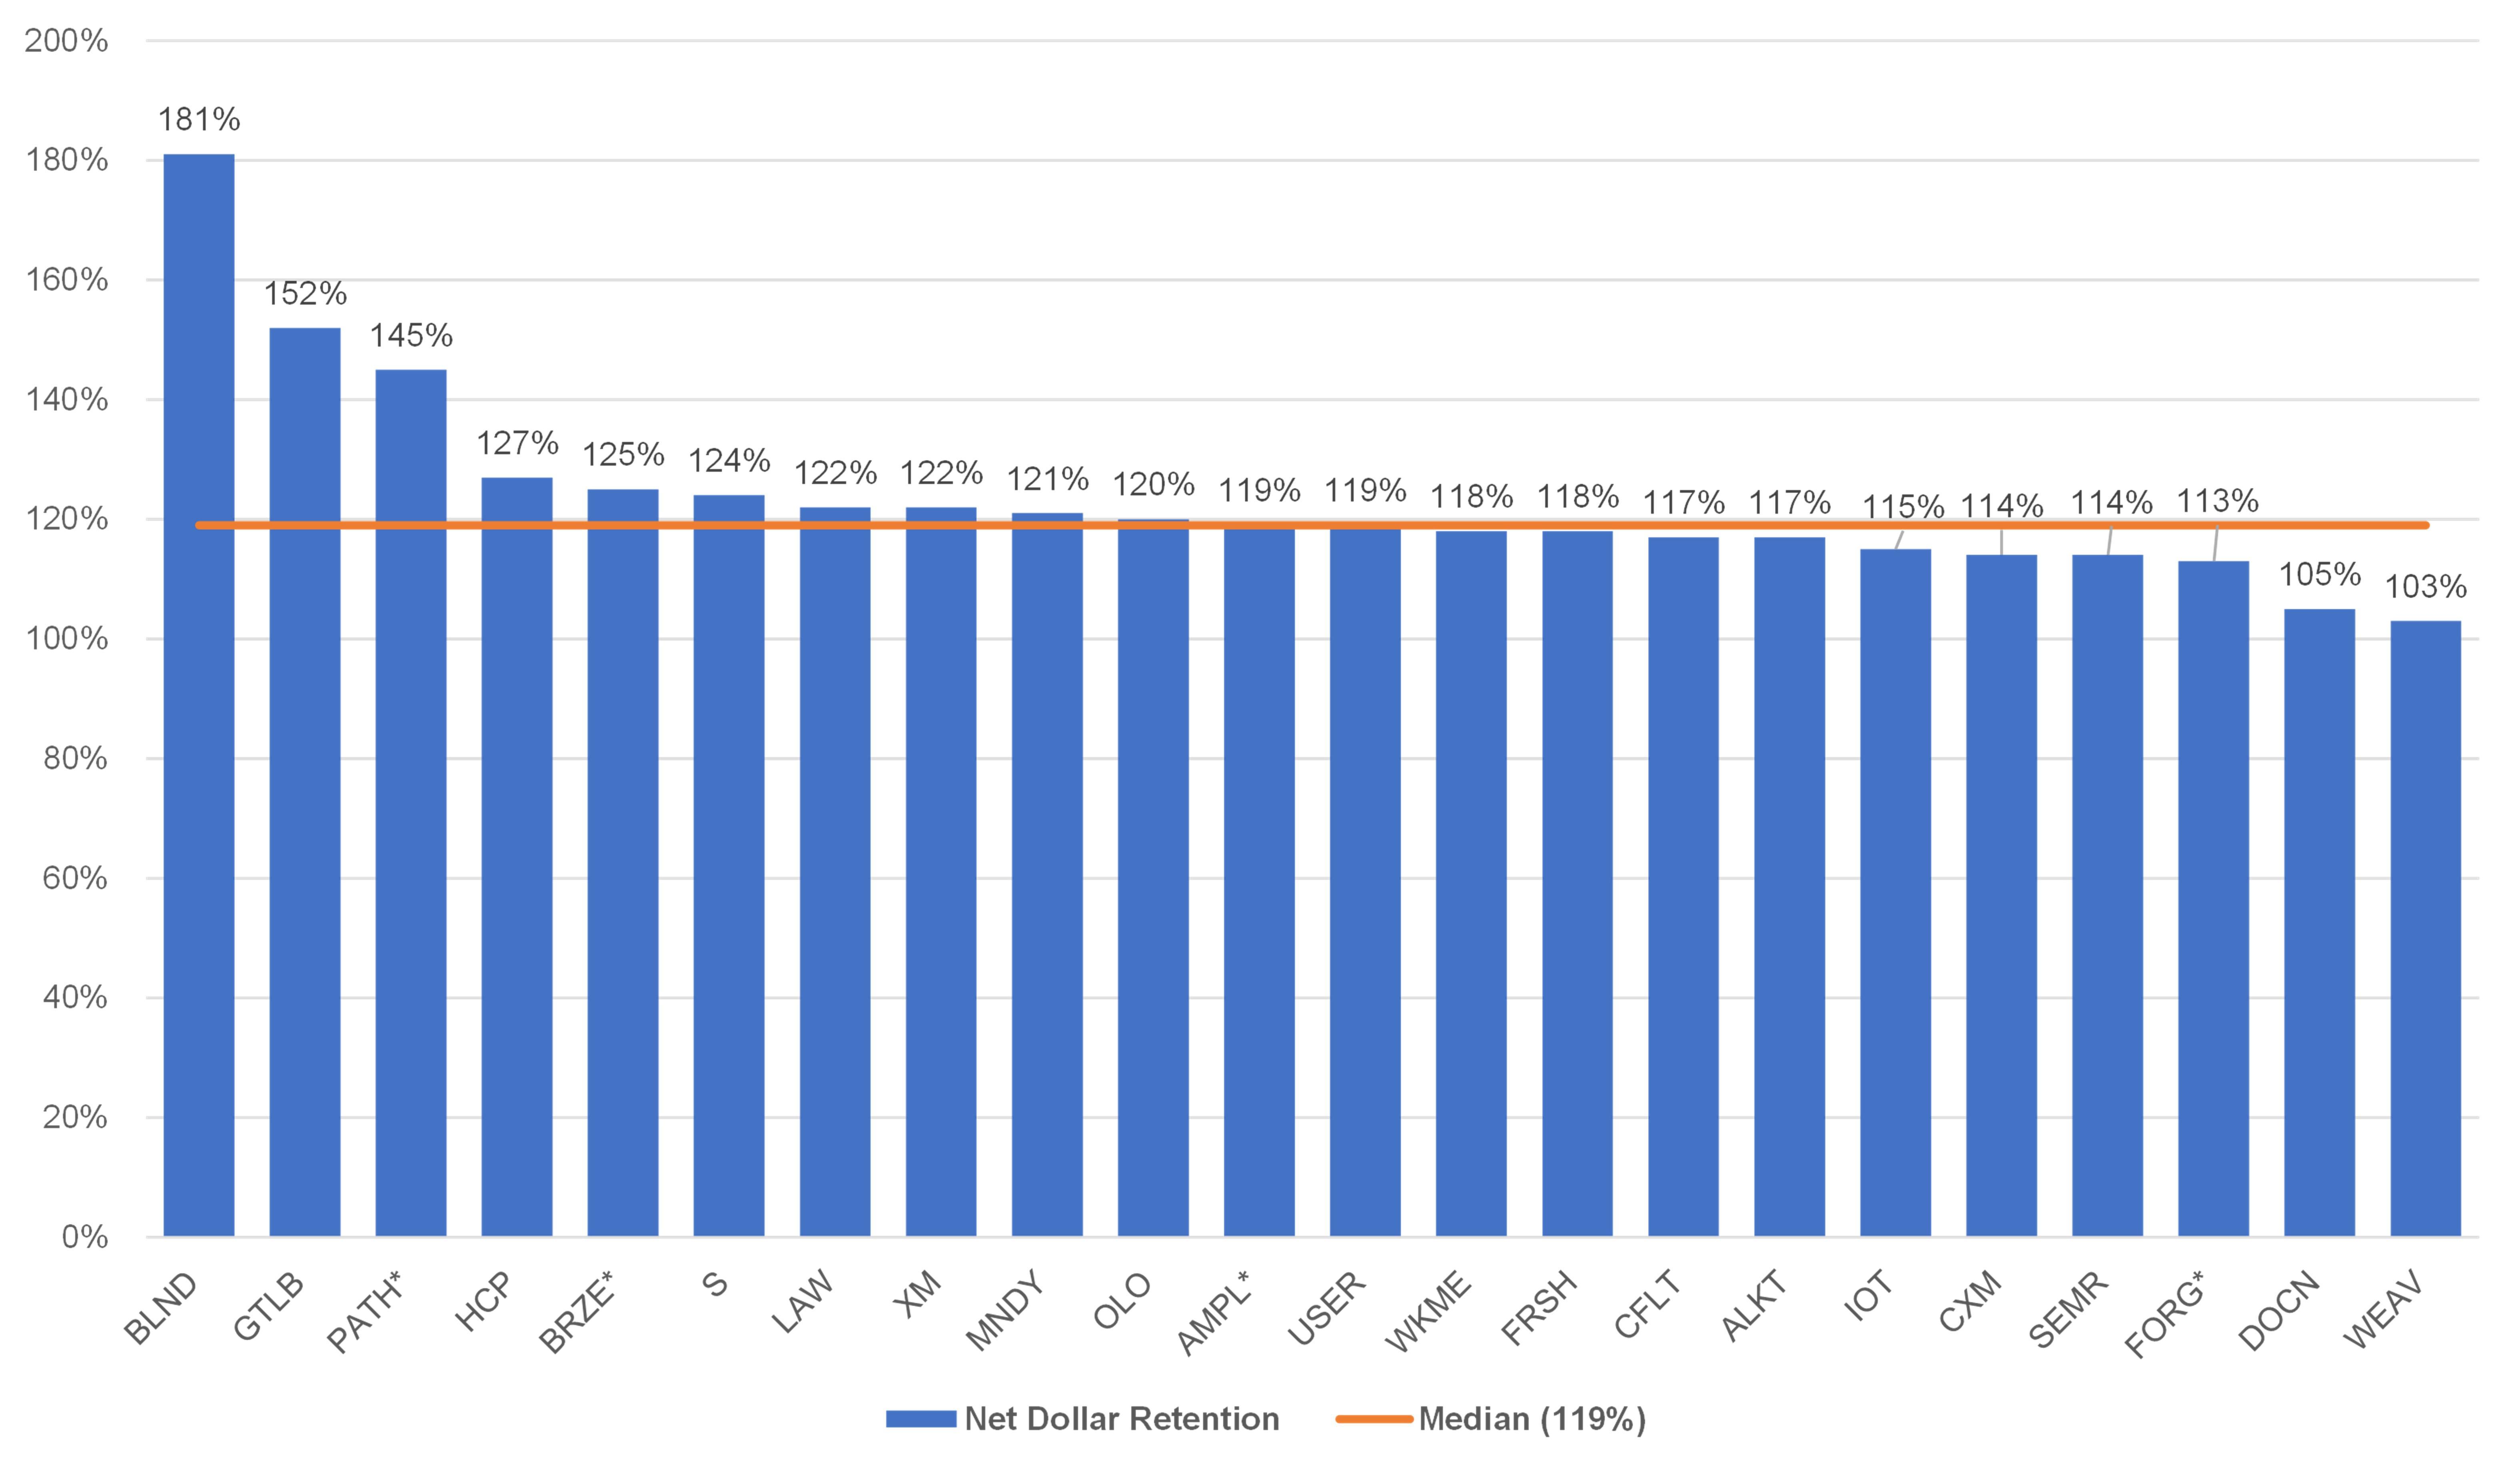
Figure 11: Average NRR at IPO for SaaS companies is 119%; all were above 100%. Average ARR at IPO is $255M. (Year 2022)
This rule isn’t important only for heavily-funded VC-backed companies gunning for hundreds of millions of ARR. It’s just as valid for the solopreneur, because NRR creates growth even with a limited budget for marketing. It also means your customers are growing with you, becoming more successful, receiving more value, and happy to share some of that with you in the form of price. This is a wonderful signal and a wonderful business model regardless of your long-term financial goals.
Max MRR vs Quick Ratio
The SaaS Quick Ratio3 is sometimes used in a similar way to Max MRR, measuring how much cancellations and downgrades are dragging down growth from new customers and upgrades:
3 Easily confused with the financial Quick Ratio, which is the ratio of ready-assets to liabilities, used to measure how easily a company will be able to cover its financial obligations.
%22%3E%3Cg%20data-mml-node=%22math%22%3E%3Cg%20data-mml-node=%22mstyle%22%3E%3Cg%20data-mml-node=%22TeXAtom%22%20data-mjx-texclass=%22ORD%22%3E%3Cg%20data-mml-node=%22mtext%22%3E%3Cpath%20data-c=%2251%22%20d=%22M56%20341q0%20158%20101%20261T388%20705q133%200%20233-104T722%20341q0-66-19-123t-43-91-57-64-48-38T525%209l-1-1h-1q1-3%203-9t11-20%2018-26%2026-20%2034-9q38%200%2063%2020T706-3q1%2013%2010%2013%205%200%2012-5l-1-18q0-75-30-127t-91-53q-43%200-68%2027T498-83Q483-23%20483-8l-12-3q-12-3-36-7t-47-4Q254-22%20155%2081T56%20341zm551-2q0%2090-21%20157T531%20598t-70%2051-71%2016-72-16-70-51-56-102-22-157q0-196%20107-282%2024-18%2028-18l-1%203q0%202%200%204-3%207-3%2022%200%2033%2024%2060t66%2027q63%200%20104-85l6-12q48%2033%2077%20106%2029%2070%2029%20175zM385%2018q19%200%2040%205t34%2010%2013%207q-1%207-4%2017T449%2088t-37%2027q-14%202-26%202-19%200-33-15T338%2067q0-19%2013-34t34-15z%22/%3E%3Cpath%20data-c=%2275%22%20d=%22M383%2058Q327-10%20256-10h-7Q124-10%20105%2089q-1%207-2%20137-1%20109-1%20122t-6%2021q-10%2016-60%2016H25v23q0%2023%202%2023l11%201q10%201%2029%202t38%202q17%201%2037%202t30%203%2012%201h3V261q1-184%203-197%203-15%2014-24%2020-14%2060-14%2026%200%2047%209t32%2023%2020%2032%2012%2030%204%2024q0%201%200%2017t1%2040%200%2047v67q0%2046-10%2057t-50%2013H302v46q2%200%2076%205t79%206h7V264q0-180%201-183%203-20%2014-26t45-9h18V0q-2%200-75-5t-77-6h-7V58z%22%20transform=%22translate(778,0)%22/%3E%3Cpath%20data-c=%2269%22%20d=%22M69%20609q0%2028%2018%2044t44%2016q23-2%2040-17t17-43q0-30-17-45t-42-15-42%2015-18%2045zM247%200Q232%203%20143%203q-11%200-37%200T56%201L34%200H26V46H42q28%200%2049%203%209%204%2011%2011t2%2042V205v88q0%2052-2%2066T88%20378q-14%207-47%207H30v23q0%2023%202%2023l10%201q10%201%2028%202t36%202q17%201%2036%202t29%203%2011%201h3V62q5-10%2012-12t35-4h23V0h-8z%22%20transform=%22translate(1334,0)%22/%3E%3Cpath%20data-c=%2263%22%20d=%22M370%20305t-21%200-36%2015-16%2038q0%2023%2015%2038%205%205%205%206t-10%202q-26%204-49%204-49%200-80-32-47-47-47-157%200-82%2031-129%2041-61%20110-61%2041%200%2066%2026t36%2062q2%208%205%2010t16%202h14q6-6%206-9%200-4-4-16T395%2071%20366%2033%20318%202%20249-11Q163-11%2099%2053T34%20214q0%20104%2065%20169t151%2065%20120-27%2034-64q0-23-17-37z%22%20transform=%22translate(1612,0)%22/%3E%3Cpath%20data-c=%226B%22%20d=%22M36%2046H50q39%200%2047%2014v8q0%209%200%2023t0%2033%201%2043%200%2050%200%2055%200%2057q0%2037%200%2078t0%2075%200%2060-1%2044%200%2017q-3%2019-14%2025t-45%209H20v23q0%2023%202%2023l10%201q10%201%2029%202t37%202q17%201%2037%202t30%203%2011%201h3V463l1-230%2060%2054q60%2054%2064%2060%206%209%206%2017%200%2019-21%2021h-5v46h9q15-3%20119-3%2063%200%2072%203h5V385H476q-69-5-116-44-74-63-74-67%200-1%2063-93T420%2079q14-19%2031-26t49-7h11V0h-6q-9%203-87%203-96%200-111-3h-8V46h7q24%202%2024%2019%200%207-4%2014-3%205-50%2074t-48%2069l-52-46V120%2084q0-19%202-25t11-10q21-3%2049-3h16V0h-8Q231%203%20137%203T28%200H20V46H36z%22%20transform=%22translate(2056,0)%22/%3E%3Cpath%20data-c=%2220%22%20d=%22%22%20transform=%22translate(2584,0)%22/%3E%3Cpath%20data-c=%2252%22%20d=%22M130%20622q-7%207-11%209t-16%203-43%203H27v46H202h34%2064q76%200%20117-6t83-29q95-48%20109-131%201-5%201-16%200-33-16-62t-38-47-45-31-39-18l-16-5q3-3%2011-6%2030-16%2049-34t29-44%2014-43%209-56%2010-61q10-48%2024-63t38-15h5q15%200%2029%2016t18%2055q0%2011%204%2014t16%204%2016-2%204-13q0-31-16-63T672-16q-16-6-42-6Q481-16%20458%2090q-2%2011-2%2073t-7%2083q-19%2058-76%2074l-10%202-66%201H231V192l1-131q6-10%2017-12t52-3h33V0H323Q302%203%20181%203%2059%203%2038%200H27V46H60q42%201%2051%203t19%2012V622zM491%20499v10q0%2018-1%2030t-9%2031-19%2031-38%2022-62%2013q-2%200-22%200t-36%201H283q-45%200-49-9-3-4-3-136V360h58q101%200%20145%2018t55%2078q2%2011%202%2043z%22%20transform=%22translate(2834,0)%22/%3E%3Cpath%20data-c=%2261%22%20d=%22M137%20305t-22%200-37%2015-15%2039q0%2035%2034%2062t121%2027q73%200%20118-32t60-76q5-14%205-31t1-115V124q0-48%205-66t21-18q15%200%2020%2016t5%2053v36h40V106q-1-40-3-47-9-30-35-47T4e2-6%20353%2012%20329%2054v4l-2-3q-2-3-5-6t-8-9-12-11-15-12T269%206%20247-2%20221-8t-31-3Q130-11%2082%2020T34%20107q0%2021%207%2040t27%2041%2048%2037%2078%2028%20110%2015h14v22q0%2034-6%2050-22%2071-97%2071-18%200-34-1t-25-4-8-3q22-15%2022-44%200-25-16-39zM126%20106q0-31%2024-55t59-25q38%200%2067%2023t39%2060q2%207%203%2066%200%2058-1%2058-8%200-21-1t-45-9-58-20-46-37-21-60z%22%20transform=%22translate(3570,0)%22/%3E%3Cpath%20data-c=%2274%22%20d=%22M27%20422q53%204%2082%2056t32%20122v15h40V431H316V385H181V241q1-125%201-141t7-32q14-39%2049-39%2044%200%2054%2071%201%208%201%2046v35h40V146%20134q0-77-42-117-27-27-70-27-34%200-59%2012T124%2033%20105%2068t-7%2032q-1%207-1%20148V385H18v37h9z%22%20transform=%22translate(4070,0)%22/%3E%3Cpath%20data-c=%2269%22%20d=%22M69%20609q0%2028%2018%2044t44%2016q23-2%2040-17t17-43q0-30-17-45t-42-15-42%2015-18%2045zM247%200Q232%203%20143%203q-11%200-37%200T56%201L34%200H26V46H42q28%200%2049%203%209%204%2011%2011t2%2042V205v88q0%2052-2%2066T88%20378q-14%207-47%207H30v23q0%2023%202%2023l10%201q10%201%2028%202t36%202q17%201%2036%202t29%203%2011%201h3V62q5-10%2012-12t35-4h23V0h-8z%22%20transform=%22translate(4459,0)%22/%3E%3Cpath%20data-c=%226F%22%20d=%22M28%20214q0%2095%2065%20164t157%2070q90%200%20155-68t66-165q0-95-64-160T250-10Q153-10%2091%2057T28%20214zM250%2030q122%200%20122%20163v32%2025q0%2022-1%2038t-7%2038-16%2036-31%2028-49%2020q-5%201-16%201-30%200-57-12-43-22-56-61t-13-92V226q0-96%2019-135%2032-61%20105-61z%22%20transform=%22translate(4737,0)%22/%3E%3C/g%3E%3Cg%20data-mml-node=%22mo%22%20transform=%22translate(5514.8,0)%22%3E%3Cpath%20data-c=%223D%22%20d=%22M56%20347q0%2013%2014%2020H707q15-8%2015-20%200-11-14-19l-318-1H72q-16%205-16%2020zm0-194q0%2015%2016%2020H708q14-10%2014-20%200-13-15-20H70q-14%207-14%2020z%22/%3E%3C/g%3E%3Cg%20data-mml-node=%22mstyle%22%20transform=%22translate(6570.6,0)%22%3E%3Cg%20data-mml-node=%22mfrac%22%3E%3Cg%20data-mml-node=%22mrow%22%20transform=%22translate(1352,676)%22%3E%3Cg%20data-mml-node=%22mtext%22%3E%3Cpath%20data-c=%224E%22%20d=%22M42%2046q32%202%2052%2010t24%2013%2010%2017V634h-4q-10%203-72%203H25v46H232l3-3q2-1%2087-126T493%20303l85-125V598q-6%2010-10%2015t-24%2014-52%2010H475v46h8q15-3%20117-3%20106%200%20115%203h9V637H707q-73-4-85-39l-1-296V6l-7-6H6e2q-15%200-18%203T481%20150%20282%20443%20171%20605V345l1-259q11-36%2085-40h17V0h-9Q250%203%20150%203%2048%203%2033%200H25V46H42z%22/%3E%3Cpath%20data-c=%2265%22%20d=%22M28%20218q0%2055%2020%201e2t50%2073%2065%2042%2066%2015q53%200%2091-18t58-50%2028-64%209-71q0-7-7-14H126V216Q126%2068%20226%2036q20-6%2044-6%2042%200%2072%2032%2017%2017%2027%2042l10%2024q3%203%2016%203h3q17%200%2017-10%200-4-3-13-19-55-63-87T250-11Q155-11%2092%2058T28%20218zm305%2057q-11%20128-95%20136h-2q-8%200-16-1t-25-8-29-21-23-41-16-66v-7H333v8z%22%20transform=%22translate(750,0)%22/%3E%3Cpath%20data-c=%2277%22%20d=%22M90%20368q-6%2010-14%2012t-36%205H18v46h6l19-1q19%200%2041-1t32-1q90%200%20105%203h8V385H215q-38-2-38-17%200-1%2044-129l44-126%2074%20215-6%2017q-10%2029-17%2034-8%205-38%206H258v46h6q6-3%2084-3%2091%200%20106%203h7V385h-9q-48%200-48-16%200-3%2014-45t31-90%2032-91l15-43%2041%20119q42%20122%2042%20128%200%2016-15%2026t-34%2012h-8v46h7q12-3%2095-3%2068%200%2074%203h5V385h-6q-1%200-6%200t-9-1q-47-7-63-50L559%20161q-13-37-31-90-20-59-25-70T487-11h-8q-19%200-23%207-1%201-49%20137L361%20267q-2-4-95-271-5-7-23-7h-5q-13%200-18%208L90%20368z%22%20transform=%22translate(1194,0)%22/%3E%3C/g%3E%3Cg%20data-mml-node=%22mo%22%20transform=%22translate(2138.2,0)%22%3E%3Cpath%20data-c=%222B%22%20d=%22M56%20237t0%2013%2014%2020H369V420l1%20150q10%2013%2019%2013%2013%200%2020-15V270H707q15-8%2015-20t-15-20H409V-68q-8-14-18-14h-2-2q-12%200-18%2014V230H70q-14%207-14%2020z%22/%3E%3C/g%3E%3Cg%20data-mml-node=%22mtext%22%20transform=%22translate(3138.4,0)%22%3E%3Cpath%20data-c=%2255%22%20d=%22M128%20622q-7%207-11%209t-16%203-43%203H25v46H36q21-3%20144-3%20135%200%20144%203h11V637H302q-40-1-51-3t-18-12l-1-204V291q0-102%208-146t40-78q45-43%20109-43%2065%200%20117%2040t65%20119q4%2023%204%20227V598q-6%2010-10%2015t-24%2014-52%2010H472v46h9q15-3%20117-3t117%203h9V637H707q-73-4-85-39l-1-199q-1-205-4-219%200-1-2-9-20-88-84-140T389-22q-85%200-163%2055T130%20192q-1%209-2%20220V622z%22/%3E%3Cpath%20data-c=%2270%22%20d=%22M36-148H50q39%200%2047%2014v8q0%207%200%2019t0%2030%201%2039T98%206t0%2049%200%2051q0%2034%200%2071t0%2066%200%2053-1%2039%200%2016q-3%2019-14%2025t-45%209H20v23q0%2023%202%2023l10%201q10%201%2029%202t37%202q17%201%2037%202t30%203%2011%201h3V416l1-26%208%207q59%2044%20138%2044%2081%200%20138-64t58-161q0-101-65-164T310-11q-68%200-120%2044l-8%207V-45-101q0-27%202-33t11-11q21-3%2049-3h16v-46h-8l-24%201q-23%201-50%201t-38%201q-103%200-112-3H20v46H36zM424%20218q0%2074-34%20129t-85%2055q-71%200-123-65V98q40-72%20112-72%2051%200%2090%2054t40%20138z%22%20transform=%22translate(750,0)%22/%3E%3Cpath%20data-c=%2267%22%20d=%22M329%20409q44%2044%201e2%2044%2030%200%2043-19t13-38q0-14-9-25t-27-11q-33%200-37%2030-2%2014%203%2021%200%201%201%203v1q-28-3-53-22-8-5-8-7%200-1%204-5t9-12%2011-18%209-26%204-33q0-62-49-105T222%20143q-50%200-99%2028-11-18-11-38%200-35%2026-52%209-6%2017-6t72-2q84-1%20108-6%2061-9%2096-41%2039-39%2039-98%200-67-78-103-60-31-142-31-83%200-143%2031Q29-140%2029-75q0%2036%2021%2060T92%2018l11%206Q67%2055%2067%20108q0%2047%2029%2085-44%2044-44%2099%200%2063%2050%20106t121%2044q51%200%2095-26l11-7zm-30-66q-5%2028-26%2044t-52%2017q-29%200-50-16t-26-45q-3-17-3-51%200-44%207-65t30-35q17-10%2043-10%2022%200%2038%207t23%2018%2011%2020%205%2015q3%2016%203%2050t-3%2051zM403-75q0%2025-14%2041T348-11%20299-2%20245%200H218q-67%200-80-6-20-9-31-28T95-74q0-10%206-23t21-30%2048-28%2080-12q69%200%20111%2028t42%2064z%22%20transform=%22translate(1306,0)%22/%3E%3Cpath%20data-c=%2272%22%20d=%22M36%2046H50q39%200%2047%2014v8q0%209%200%2023t1%2031%200%2039%200%2042q0%2031%200%2066t0%2059l-1%2023q-3%2019-14%2025t-45%209H20v23q0%2023%202%2023l10%201q10%201%2028%202t36%202q16%201%2035%202t29%203%2011%201h3V373q39%2068%2097%2068h6q45%200%2066-22t21-46q0-21-13-36t-38-15-37%2016-13%2034q0%209%202%2016t5%2012%203%205q-2%202-23-4-16-8-24-15-47-45-47-179V154q0-13%200-27t0-26%201-20%200-15V61q1-2%203-4t5-3%205-3%207-2%207-1%209-1%209%200%2010-1%2010%200h31V0h-9Q249%203%20140%203%2037%203%2028%200H20V46H36z%22%20transform=%22translate(1806,0)%22/%3E%3Cpath%20data-c=%2261%22%20d=%22M137%20305t-22%200-37%2015-15%2039q0%2035%2034%2062t121%2027q73%200%20118-32t60-76q5-14%205-31t1-115V124q0-48%205-66t21-18q15%200%2020%2016t5%2053v36h40V106q-1-40-3-47-9-30-35-47T4e2-6%20353%2012%20329%2054v4l-2-3q-2-3-5-6t-8-9-12-11-15-12T269%206%20247-2%20221-8t-31-3Q130-11%2082%2020T34%20107q0%2021%207%2040t27%2041%2048%2037%2078%2028%20110%2015h14v22q0%2034-6%2050-22%2071-97%2071-18%200-34-1t-25-4-8-3q22-15%2022-44%200-25-16-39zM126%20106q0-31%2024-55t59-25q38%200%2067%2023t39%2060q2%207%203%2066%200%2058-1%2058-8%200-21-1t-45-9-58-20-46-37-21-60z%22%20transform=%22translate(2198,0)%22/%3E%3Cpath%20data-c=%2264%22%20d=%22M376%20495q0%2016%200%2040t1%2033q0%2045-10%2056t-51%2013H298v23q0%2023%202%2023l10%201q10%201%2029%202t37%202q17%201%2037%202t30%203%2011%201h3V390q0-306%201-309%203-20%2014-26t45-9h18V0q-2%200-76-5t-79-6h-7V44l-8-7Q307-11%20235-11%20158-11%2096%2050T34%20215q0%201e2%2063%20163t147%2064q75%200%20132-49V495zm-3-153q-45%2063-113%2063-49%200-87-36-27-28-34-64t-8-94q0-56%207-91t35-61q30-33%2078-33%2071%200%20122%2077V342z%22%20transform=%22translate(2698,0)%22/%3E%3Cpath%20data-c=%2265%22%20d=%22M28%20218q0%2055%2020%201e2t50%2073%2065%2042%2066%2015q53%200%2091-18t58-50%2028-64%209-71q0-7-7-14H126V216Q126%2068%20226%2036q20-6%2044-6%2042%200%2072%2032%2017%2017%2027%2042l10%2024q3%203%2016%203h3q17%200%2017-10%200-4-3-13-19-55-63-87T250-11Q155-11%2092%2058T28%20218zm305%2057q-11%20128-95%20136h-2q-8%200-16-1t-25-8-29-21-23-41-16-66v-7H333v8z%22%20transform=%22translate(3254,0)%22/%3E%3C/g%3E%3C/g%3E%3Cg%20data-mml-node=%22mrow%22%20transform=%22translate(220,-686)%22%3E%3Cg%20data-mml-node=%22mtext%22%3E%3Cpath%20data-c=%2243%22%20d=%22M56%20342q0%2086%2033%20158t85%20115%20109%2066%20108%2024q3%200%209%200t8-1q91%200%20161-68l13-12%2030%2039q27%2037%2031%2041%201%200%204%200t6%201h4q3%200%209-6V419l-6-6H626q-6%206-7%2017-9%2082-48%20142t-95%2079q-19%207-50%207-104%200-174-70-79-79-79-246%200-121%2038-191%2021-40%2052-67t65-39%2056-16%2044-5q89%200%20143%2069t55%20151q0%207%206%2013h28l6-6V236q-5-103-76-180T403-21Q262-21%20159%2083T56%20342z%22/%3E%3Cpath%20data-c=%2261%22%20d=%22M137%20305t-22%200-37%2015-15%2039q0%2035%2034%2062t121%2027q73%200%20118-32t60-76q5-14%205-31t1-115V124q0-48%205-66t21-18q15%200%2020%2016t5%2053v36h40V106q-1-40-3-47-9-30-35-47T4e2-6%20353%2012%20329%2054v4l-2-3q-2-3-5-6t-8-9-12-11-15-12T269%206%20247-2%20221-8t-31-3Q130-11%2082%2020T34%20107q0%2021%207%2040t27%2041%2048%2037%2078%2028%20110%2015h14v22q0%2034-6%2050-22%2071-97%2071-18%200-34-1t-25-4-8-3q22-15%2022-44%200-25-16-39zM126%20106q0-31%2024-55t59-25q38%200%2067%2023t39%2060q2%207%203%2066%200%2058-1%2058-8%200-21-1t-45-9-58-20-46-37-21-60z%22%20transform=%22translate(722,0)%22/%3E%3Cpath%20data-c=%226E%22%20d=%22M41%2046H55q39%200%2047%2014v8q0%209%200%2023t0%2031%201%2039%200%2042q0%2031%200%2066t-1%2059v23q-3%2019-14%2025t-45%209H25v23q0%2023%202%2023l10%201q10%201%2028%202t37%202q17%201%2036%202t29%203%2011%201h3V402q0-38%201-38t5%205%2012%2015%2019%2018%2029%2019%2038%2016%2051%205q114-4%20127-113%201-7%201-139V104q0-38%202-45t11-10q21-3%2049-3h16V0h-8L510%201q-23%201-50%201T422%203Q319%203%20310%200h-8V46h16q61%200%2061%2016%201%202%201%20138-1%20135-2%20143-6%2028-20%2042t-24%2017-26%202q-45%200-79-34-27-27-34-55t-8-83V168%20108q0-30%201-40t3-13%209-6q21-3%2049-3h16V0h-8L234%201q-24%201-51%201T145%203Q42%203%2033%200H25V46H41z%22%20transform=%22translate(1222,0)%22/%3E%3Cpath%20data-c=%2263%22%20d=%22M370%20305t-21%200-36%2015-16%2038q0%2023%2015%2038%205%205%205%206t-10%202q-26%204-49%204-49%200-80-32-47-47-47-157%200-82%2031-129%2041-61%20110-61%2041%200%2066%2026t36%2062q2%208%205%2010t16%202h14q6-6%206-9%200-4-4-16T395%2071%20366%2033%20318%202%20249-11Q163-11%2099%2053T34%20214q0%20104%2065%20169t151%2065%20120-27%2034-64q0-23-17-37z%22%20transform=%22translate(1778,0)%22/%3E%3Cpath%20data-c=%2265%22%20d=%22M28%20218q0%2055%2020%201e2t50%2073%2065%2042%2066%2015q53%200%2091-18t58-50%2028-64%209-71q0-7-7-14H126V216Q126%2068%20226%2036q20-6%2044-6%2042%200%2072%2032%2017%2017%2027%2042l10%2024q3%203%2016%203h3q17%200%2017-10%200-4-3-13-19-55-63-87T250-11Q155-11%2092%2058T28%20218zm305%2057q-11%20128-95%20136h-2q-8%200-16-1t-25-8-29-21-23-41-16-66v-7H333v8z%22%20transform=%22translate(2222,0)%22/%3E%3Cpath%20data-c=%226C%22%20d=%22M42%2046H56q39%200%2047%2014v8q0%209%200%2023t0%2033%201%2043%200%2050%200%2055%200%2057q0%2037%200%2078t0%2075%200%2060-1%2044%200%2017q-3%2019-14%2025t-45%209H26v23q0%2023%202%2023l10%201q10%201%2029%202t37%202q17%201%2037%202t30%203%2011%201h3V379q0-317%201-319%204-8%2012-11%2021-3%2049-3h16V0h-8L232%201q-23%201-49%201T145%203%20107%203%2057%201L34%200H26V46H42z%22%20transform=%22translate(2666,0)%22/%3E%3C/g%3E%3Cg%20data-mml-node=%22mo%22%20transform=%22translate(3166.2,0)%22%3E%3Cpath%20data-c=%222B%22%20d=%22M56%20237t0%2013%2014%2020H369V420l1%20150q10%2013%2019%2013%2013%200%2020-15V270H707q15-8%2015-20t-15-20H409V-68q-8-14-18-14h-2-2q-12%200-18%2014V230H70q-14%207-14%2020z%22/%3E%3C/g%3E%3Cg%20data-mml-node=%22mtext%22%20transform=%22translate(4166.4,0)%22%3E%3Cpath%20data-c=%2244%22%20d=%22M130%20622q-7%207-11%209t-16%203-43%203H27v46H228q171-1%20191-1t42-6q43-9%2085-35t80-68%2059-103%2023-134q0-126-74-220T442%203Q429%201%20228%200H27V46H60q42%201%2051%203t19%2012V622zM593%20338q0%20101-22%20163T493%20602q-54%2035-138%2035H322%20294q-56%200-60-9-3-4-3-284%200-282%201-285%201-10%2016-11t91-2h11q106%200%20165%2049%2046%2038%2062%2096t16%20147z%22/%3E%3Cpath%20data-c=%226F%22%20d=%22M28%20214q0%2095%2065%20164t157%2070q90%200%20155-68t66-165q0-95-64-160T250-10Q153-10%2091%2057T28%20214zM250%2030q122%200%20122%20163v32%2025q0%2022-1%2038t-7%2038-16%2036-31%2028-49%2020q-5%201-16%201-30%200-57-12-43-22-56-61t-13-92V226q0-96%2019-135%2032-61%20105-61z%22%20transform=%22translate(764,0)%22/%3E%3Cpath%20data-c=%2277%22%20d=%22M90%20368q-6%2010-14%2012t-36%205H18v46h6l19-1q19%200%2041-1t32-1q90%200%20105%203h8V385H215q-38-2-38-17%200-1%2044-129l44-126%2074%20215-6%2017q-10%2029-17%2034-8%205-38%206H258v46h6q6-3%2084-3%2091%200%20106%203h7V385h-9q-48%200-48-16%200-3%2014-45t31-90%2032-91l15-43%2041%20119q42%20122%2042%20128%200%2016-15%2026t-34%2012h-8v46h7q12-3%2095-3%2068%200%2074%203h5V385h-6q-1%200-6%200t-9-1q-47-7-63-50L559%20161q-13-37-31-90-20-59-25-70T487-11h-8q-19%200-23%207-1%201-49%20137L361%20267q-2-4-95-271-5-7-23-7h-5q-13%200-18%208L90%20368z%22%20transform=%22translate(1264,0)%22/%3E%3Cpath%20data-c=%226E%22%20d=%22M41%2046H55q39%200%2047%2014v8q0%209%200%2023t0%2031%201%2039%200%2042q0%2031%200%2066t-1%2059v23q-3%2019-14%2025t-45%209H25v23q0%2023%202%2023l10%201q10%201%2028%202t37%202q17%201%2036%202t29%203%2011%201h3V402q0-38%201-38t5%205%2012%2015%2019%2018%2029%2019%2038%2016%2051%205q114-4%20127-113%201-7%201-139V104q0-38%202-45t11-10q21-3%2049-3h16V0h-8L510%201q-23%201-50%201T422%203Q319%203%20310%200h-8V46h16q61%200%2061%2016%201%202%201%20138-1%20135-2%20143-6%2028-20%2042t-24%2017-26%202q-45%200-79-34-27-27-34-55t-8-83V168%20108q0-30%201-40t3-13%209-6q21-3%2049-3h16V0h-8L234%201q-24%201-51%201T145%203Q42%203%2033%200H25V46H41z%22%20transform=%22translate(1986,0)%22/%3E%3Cpath%20data-c=%2267%22%20d=%22M329%20409q44%2044%201e2%2044%2030%200%2043-19t13-38q0-14-9-25t-27-11q-33%200-37%2030-2%2014%203%2021%200%201%201%203v1q-28-3-53-22-8-5-8-7%200-1%204-5t9-12%2011-18%209-26%204-33q0-62-49-105T222%20143q-50%200-99%2028-11-18-11-38%200-35%2026-52%209-6%2017-6t72-2q84-1%20108-6%2061-9%2096-41%2039-39%2039-98%200-67-78-103-60-31-142-31-83%200-143%2031Q29-140%2029-75q0%2036%2021%2060T92%2018l11%206Q67%2055%2067%20108q0%2047%2029%2085-44%2044-44%2099%200%2063%2050%20106t121%2044q51%200%2095-26l11-7zm-30-66q-5%2028-26%2044t-52%2017q-29%200-50-16t-26-45q-3-17-3-51%200-44%207-65t30-35q17-10%2043-10%2022%200%2038%207t23%2018%2011%2020%205%2015q3%2016%203%2050t-3%2051zM403-75q0%2025-14%2041T348-11%20299-2%20245%200H218q-67%200-80-6-20-9-31-28T95-74q0-10%206-23t21-30%2048-28%2080-12q69%200%20111%2028t42%2064z%22%20transform=%22translate(2542,0)%22/%3E%3Cpath%20data-c=%2272%22%20d=%22M36%2046H50q39%200%2047%2014v8q0%209%200%2023t1%2031%200%2039%200%2042q0%2031%200%2066t0%2059l-1%2023q-3%2019-14%2025t-45%209H20v23q0%2023%202%2023l10%201q10%201%2028%202t36%202q16%201%2035%202t29%203%2011%201h3V373q39%2068%2097%2068h6q45%200%2066-22t21-46q0-21-13-36t-38-15-37%2016-13%2034q0%209%202%2016t5%2012%203%205q-2%202-23-4-16-8-24-15-47-45-47-179V154q0-13%200-27t0-26%201-20%200-15V61q1-2%203-4t5-3%205-3%207-2%207-1%209-1%209%200%2010-1%2010%200h31V0h-9Q249%203%20140%203%2037%203%2028%200H20V46H36z%22%20transform=%22translate(3042,0)%22/%3E%3Cpath%20data-c=%2261%22%20d=%22M137%20305t-22%200-37%2015-15%2039q0%2035%2034%2062t121%2027q73%200%20118-32t60-76q5-14%205-31t1-115V124q0-48%205-66t21-18q15%200%2020%2016t5%2053v36h40V106q-1-40-3-47-9-30-35-47T4e2-6%20353%2012%20329%2054v4l-2-3q-2-3-5-6t-8-9-12-11-15-12T269%206%20247-2%20221-8t-31-3Q130-11%2082%2020T34%20107q0%2021%207%2040t27%2041%2048%2037%2078%2028%20110%2015h14v22q0%2034-6%2050-22%2071-97%2071-18%200-34-1t-25-4-8-3q22-15%2022-44%200-25-16-39zM126%20106q0-31%2024-55t59-25q38%200%2067%2023t39%2060q2%207%203%2066%200%2058-1%2058-8%200-21-1t-45-9-58-20-46-37-21-60z%22%20transform=%22translate(3434,0)%22/%3E%3Cpath%20data-c=%2264%22%20d=%22M376%20495q0%2016%200%2040t1%2033q0%2045-10%2056t-51%2013H298v23q0%2023%202%2023l10%201q10%201%2029%202t37%202q17%201%2037%202t30%203%2011%201h3V390q0-306%201-309%203-20%2014-26t45-9h18V0q-2%200-76-5t-79-6h-7V44l-8-7Q307-11%20235-11%20158-11%2096%2050T34%20215q0%201e2%2063%20163t147%2064q75%200%20132-49V495zm-3-153q-45%2063-113%2063-49%200-87-36-27-28-34-64t-8-94q0-56%207-91t35-61q30-33%2078-33%2071%200%20122%2077V342z%22%20transform=%22translate(3934,0)%22/%3E%3Cpath%20data-c=%2265%22%20d=%22M28%20218q0%2055%2020%201e2t50%2073%2065%2042%2066%2015q53%200%2091-18t58-50%2028-64%209-71q0-7-7-14H126V216Q126%2068%20226%2036q20-6%2044-6%2042%200%2072%2032%2017%2017%2027%2042l10%2024q3%203%2016%203h3q17%200%2017-10%200-4-3-13-19-55-63-87T250-11Q155-11%2092%2058T28%20218zm305%2057q-11%20128-95%20136h-2q-8%200-16-1t-25-8-29-21-23-41-16-66v-7H333v8z%22%20transform=%22translate(4490,0)%22/%3E%3C/g%3E%3C/g%3E%3Crect%20width=%229300.4%22%20height=%2260%22%20x=%22120%22%20y=%22220%22/%3E%3C/g%3E%3C/g%3E%3C/g%3E%3C/g%3E%3C/g%3E%3C/g%3E%3C/svg%3E)
A high-growth, early-scale company should have a Quick Ratio of 3-4; a company at scale with healthy growth should be 1.5-2. Once it reaches 1, the company isn’t growing, and below 1, it is contracting. This is similar to Max MRR.
However, useful as it is, it does not forecast revenue growth at all, as is evident from Buffer’s Quick Ratio:

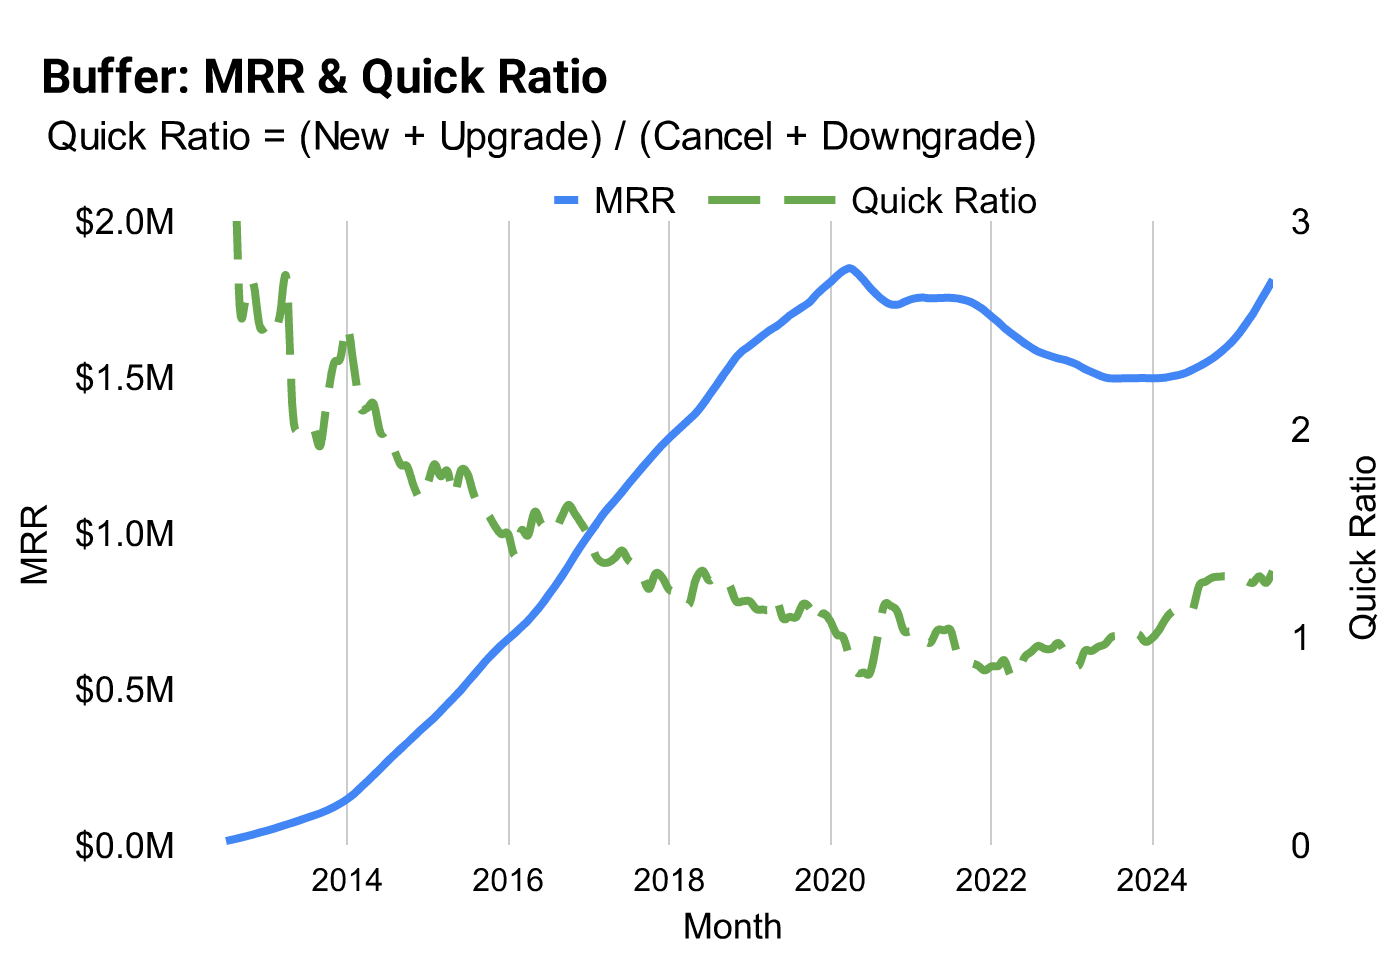
Figure 12: Buffer’s Quick Ratio is uncorrelated with revenue growth.
Buffer’s Quick Ratio drops precipitously during Buffer’s multi-year period of healthy growth. It continues its downward trajectory even when growth stalls and reverses. It starts recovering before the company actually made positive changes in 2023, and still doesn’t seem very strong in 2025 when clearly growth has dramatically changed (and Max MRR does dramatically increase).
This doesn’t invalidate Quick Ratio as a useful metric, it just isn’t a predictor of revenue growth. Max MRR is.
Also, Max MRR is easier to understand and get excited about. It feels tangible to have a “revenue ceiling” that you are trying to increase. It’s harder to get excited about a goal like: “Let’s get our Quick Ratio from 1.4 to 1.6.”
No metric tells the entire story on its own; Max MRR is no exception.
But, it’s a fun, simple, explanatory, predictive, and concrete number that is applicable for companies of all stages and sizes.
Now go get your cancellation rate under control, and then switch your focus to NRR.
https://longform.asmartbear.com/max-mrr/
© 2007-2026 Jason Cohen
 @asmartbear


