 ePub (Kindle)
 Printable PDF
The Elephant in the room: The myth of exponential hypergrowth
A startup is growing fast, the journalists marveling at its “meteoric rise.” But don’t meteors fall?
Inevitably it is breathlessly inducted into the class of “hypergrowth” companies that are “growing exponentially.” Especially when the product is “viral.” After all, if every person brings three friends, and each of those brings another three, is that not exponential?
But “exponential” is an incorrect characterization, as we’ll see in real-world data, even for hypergrowth, “viral” companies like Facebook and Slack.
This article suggests an alternate model for how fast-growing companies actually grow. Understanding the model is useful not only for predicting growth, but because understanding the foundational drivers of growth allows us to take smarter actions to create growth in our own companies.
Dispelling “exponential”
To evaluate whether hypergrowth is properly described as “exponential,” let’s recall what that word means. Here’s an exponential curve (like %22%3E%3Cg%20data-mml-node=%22math%22%3E%3Cg%20data-mml-node=%22mstyle%22%3E%3Cg%20data-mml-node=%22TeXAtom%22%20data-mjx-texclass=%22ORD%22%3E%3Cg%20data-mml-node=%22mi%22%3E%3Cpath%20data-c=%221D466%22%20d=%22M21%20287q0%2014%2015%2048t48%2071%2074%2036q41%200%2066-23t26-64q-2-19-3-21%200-3-16-46t-33-97-16-86q0-43%2014-60t42-18q23%200%2043%2011t31%2023%2027%2033q0%201%205%2020t14%2059%2019%2074q38%20150%2042%20157%2013%2027%2043%2027%2013%200%2021-7t11-12%202-9q0-13-49-210T391-23q-28-83-97-132T156-205q-45%200-79%2022T43-117q0%2022%207%2037T69-58%2089-48t17%203q44%200%2044-42%200-20-12-35t-23-20-13-5l-3-1q2-5%2019-12t34-7h8q17%200%2026%202%2033%209%2061%2038t43%2062T313-9t8%2030l-6-4q-6-4-19-11T270-6q-20-5-39-5-46%200-81%2022T104%2082q-1%207-1%2031%200%2057%2035%20149t35%20117q0%201%200%202%200%209%200%2012t-4%207-11%204h-4q-23%200-42-19T82%20344%2065%20302t-8-22-16-2H27q-6%206-6%209z%22/%3E%3C/g%3E%3Cg%20data-mml-node=%22mo%22%20transform=%22translate(767.8,0)%22%3E%3Cpath%20data-c=%223D%22%20d=%22M56%20347q0%2013%2014%2020H707q15-8%2015-20%200-11-14-19l-318-1H72q-16%205-16%2020zm0-194q0%2015%2016%2020H708q14-10%2014-20%200-13-15-20H70q-14%207-14%2020z%22/%3E%3C/g%3E%3Cg%20data-mml-node=%22msup%22%20transform=%22translate(1823.6,0)%22%3E%3Cg%20data-mml-node=%22mn%22%3E%3Cpath%20data-c=%2232%22%20d=%22M109%20429q-27%200-43%2018T50%20491q0%2071%2053%20123t132%2052q91%200%20152-56t62-145q0-43-20-82t-48-68-80-74q-36-31-1e2-92L142%2093l76-1q157%200%20167%205%207%202%2024%2089v3h40v-3q-1-3-13-91T421%203V0H50V19%2031q0%207%206%2015T86%2081q29%2032%2050%2056%209%2010%2034%2037t34%2037%2029%2033%2028%2034%2023%2030%2021%2032%2015%2029%2013%2032%207%2030%203%2033q0%2063-34%20109t-97%2046q-33%200-58-17t-35-33-10-19q0-1%205-1%2018%200%2037-14t19-46q0-25-16-42t-45-18z%22/%3E%3C/g%3E%3Cg%20data-mml-node=%22mi%22%20transform=%22translate(533,363)%20scale(0.707)%22%3E%3Cpath%20data-c=%221D465%22%20d=%22M52%20289q7%2042%2054%2097t116%2056q35%200%2064-18t43-45q42%2063%20101%2063%2037%200%2064-22t28-59q0-29-14-47t-27-22-23-4q-19%200-31%2011t-12%2029q0%2046%2050%2063-11%2013-40%2013-13%200-19-2-38-16-56-66-60-221-60-258%200-28%2016-40t35-12q37%200%2073%2033t49%2081q3%2010%206%2011t16%202h4q15%200%2015-8%200-1-2-11-16-57-62-101T333-11q-70%200-106%2063-41-62-94-62h-6Q78-10%2057%2016T35%2071q0%2032%2019%2052t45%2020q43%200%2043-42%200-20-12-35T107%2046%2094%2041l-3-1q0-1%206-4t16-7%2019-3q36%200%2062%2045%209%2016%2023%2068t28%20108%2016%2066q5%2027%205%2039%200%2028-15%2040t-34%2012q-40%200-75-32T93%20290q-2-9-5-10t-16-2H58q-6%206-6%2011z%22/%3E%3C/g%3E%3C/g%3E%3C/g%3E%3C/g%3E%3C/g%3E%3C/g%3E%3C/svg%3E) ), compared to a quadratic one (like
), compared to a quadratic one (like %22%3E%3Cg%20data-mml-node=%22math%22%3E%3Cg%20data-mml-node=%22mstyle%22%3E%3Cg%20data-mml-node=%22TeXAtom%22%20data-mjx-texclass=%22ORD%22%3E%3Cg%20data-mml-node=%22mi%22%3E%3Cpath%20data-c=%221D466%22%20d=%22M21%20287q0%2014%2015%2048t48%2071%2074%2036q41%200%2066-23t26-64q-2-19-3-21%200-3-16-46t-33-97-16-86q0-43%2014-60t42-18q23%200%2043%2011t31%2023%2027%2033q0%201%205%2020t14%2059%2019%2074q38%20150%2042%20157%2013%2027%2043%2027%2013%200%2021-7t11-12%202-9q0-13-49-210T391-23q-28-83-97-132T156-205q-45%200-79%2022T43-117q0%2022%207%2037T69-58%2089-48t17%203q44%200%2044-42%200-20-12-35t-23-20-13-5l-3-1q2-5%2019-12t34-7h8q17%200%2026%202%2033%209%2061%2038t43%2062T313-9t8%2030l-6-4q-6-4-19-11T270-6q-20-5-39-5-46%200-81%2022T104%2082q-1%207-1%2031%200%2057%2035%20149t35%20117q0%201%200%202%200%209%200%2012t-4%207-11%204h-4q-23%200-42-19T82%20344%2065%20302t-8-22-16-2H27q-6%206-6%209z%22/%3E%3C/g%3E%3Cg%20data-mml-node=%22mo%22%20transform=%22translate(767.8,0)%22%3E%3Cpath%20data-c=%223D%22%20d=%22M56%20347q0%2013%2014%2020H707q15-8%2015-20%200-11-14-19l-318-1H72q-16%205-16%2020zm0-194q0%2015%2016%2020H708q14-10%2014-20%200-13-15-20H70q-14%207-14%2020z%22/%3E%3C/g%3E%3Cg%20data-mml-node=%22msup%22%20transform=%22translate(1823.6,0)%22%3E%3Cg%20data-mml-node=%22mi%22%3E%3Cpath%20data-c=%221D465%22%20d=%22M52%20289q7%2042%2054%2097t116%2056q35%200%2064-18t43-45q42%2063%20101%2063%2037%200%2064-22t28-59q0-29-14-47t-27-22-23-4q-19%200-31%2011t-12%2029q0%2046%2050%2063-11%2013-40%2013-13%200-19-2-38-16-56-66-60-221-60-258%200-28%2016-40t35-12q37%200%2073%2033t49%2081q3%2010%206%2011t16%202h4q15%200%2015-8%200-1-2-11-16-57-62-101T333-11q-70%200-106%2063-41-62-94-62h-6Q78-10%2057%2016T35%2071q0%2032%2019%2052t45%2020q43%200%2043-42%200-20-12-35T107%2046%2094%2041l-3-1q0-1%206-4t16-7%2019-3q36%200%2062%2045%209%2016%2023%2068t28%20108%2016%2066q5%2027%205%2039%200%2028-15%2040t-34%2012q-40%200-75-32T93%20290q-2-9-5-10t-16-2H58q-6%206-6%2011z%22/%3E%3C/g%3E%3Cg%20data-mml-node=%22mn%22%20transform=%22translate(605,363)%20scale(0.707)%22%3E%3Cpath%20data-c=%2232%22%20d=%22M109%20429q-27%200-43%2018T50%20491q0%2071%2053%20123t132%2052q91%200%20152-56t62-145q0-43-20-82t-48-68-80-74q-36-31-1e2-92L142%2093l76-1q157%200%20167%205%207%202%2024%2089v3h40v-3q-1-3-13-91T421%203V0H50V19%2031q0%207%206%2015T86%2081q29%2032%2050%2056%209%2010%2034%2037t34%2037%2029%2033%2028%2034%2023%2030%2021%2032%2015%2029%2013%2032%207%2030%203%2033q0%2063-34%20109t-97%2046q-33%200-58-17t-35-33-10-19q0-1%205-1%2018%200%2037-14t19-46q0-25-16-42t-45-18z%22/%3E%3C/g%3E%3C/g%3E%3C/g%3E%3C/g%3E%3C/g%3E%3C/g%3E%3C/svg%3E) ):
):

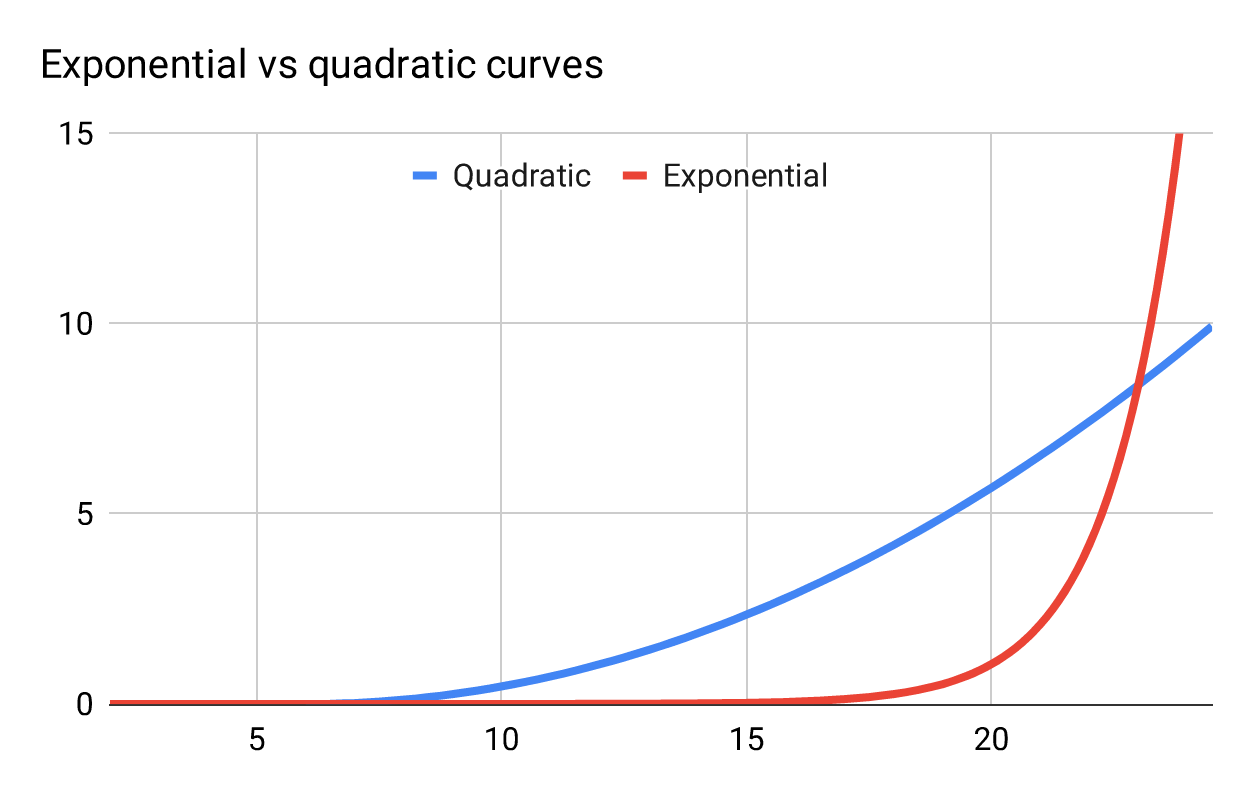
Figure 1
In exponential growth, values grow by a multiple. For example: In year 1 you grow 10, in year 2 by 100, in year 3 by 1000—each time the amount of growth is multiplied by ten. The compounding effect of multiplication causes the numbers to grow slowly initially, then skyrocket. The compounding effect gets journalists and VCs justifiably excited.
Compound interest is the most powerful force in the universe.
—Albert Einstein
In quadratic growth, values grow by a adding a constant amount more each time-interval, rather than multiplying a constant amount more each time-interval. In the same example, growing in year 1 by 10, then in year 2 by 20, in year 3 by 30:

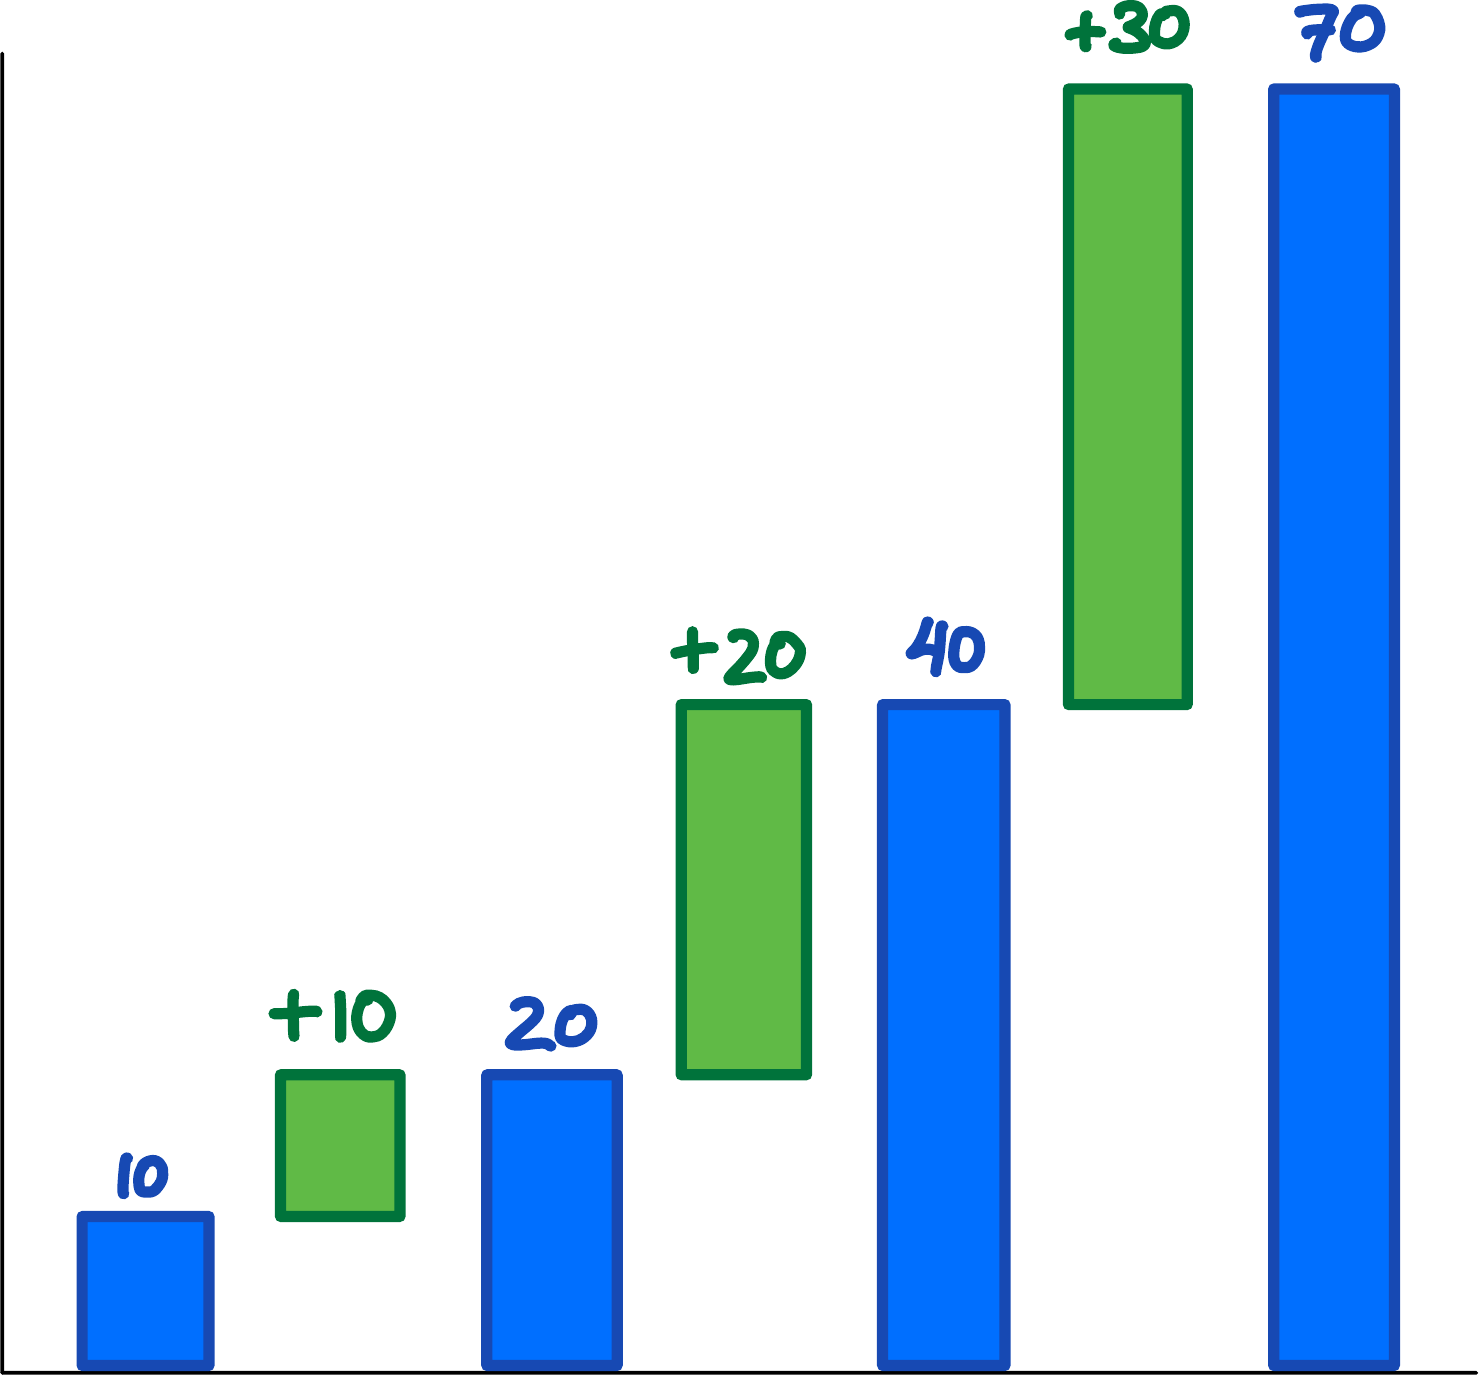
Figure 2: Successive values (in blue) are increasing more and more (in green). The green differences are increasing linearly: 10, 20, 30.
Growth is still accelerating, so the blue curve slopes upwards, but gently compared to exponential growth.
With these patterns in mind, let’s examine real-world data, and see whether “exponential” is the right model.
Facebook is the definition of hypergrowth—getting to $50B in revenue faster than any company in history. The product is “viral”—friends bring other friends—which theoretically leads to “exponential growth.” But Facebook didn’t grow exponentially in the number of monthly active users:

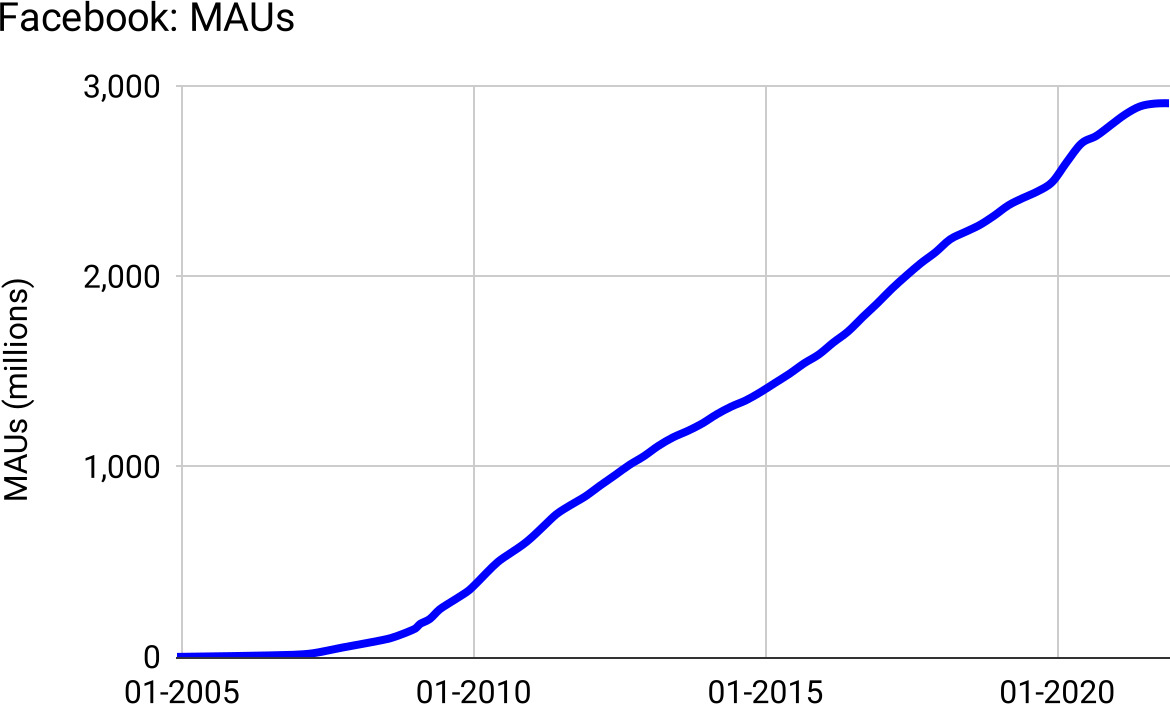
Figure 3: Essentially linear for nearly twenty years, only exponential in the first four years.
Slack was the fastest-growing enterprise software company ever, going from $0 to $10M ARR in their first 10 months, and 0 to 10,000,000 active users in just five years. It’s also a “viral” product—organizations invite their members, who then create their own Slack-groups and invite others. So surely Slack has exponential growth? (Figure 4)

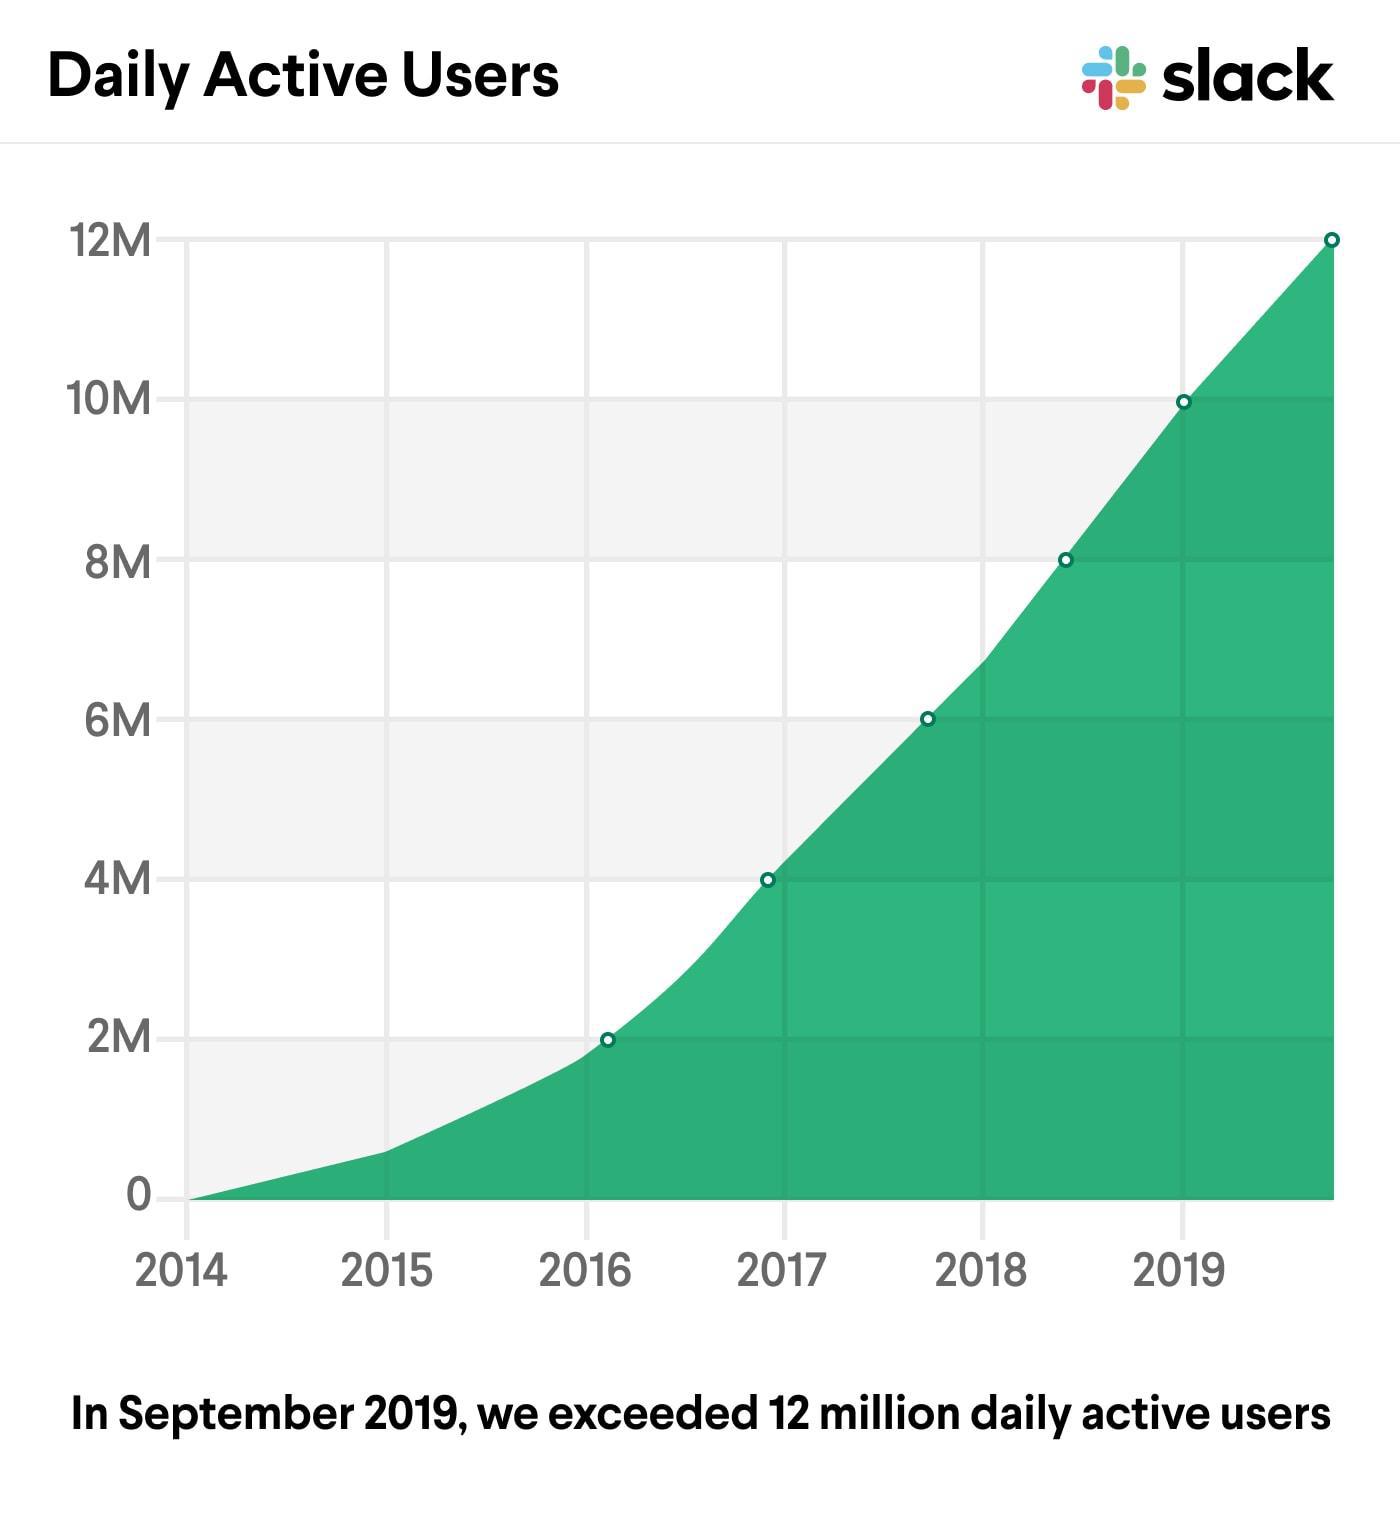
Figure 4: Slack’s own data shows initial quadratic growth, followed by years of linear growth.
Dropbox was another “hypergrowth” company, achieving 100,000,000 registered users five years after being founded in 2007, but it wasn’t exponential, neither in freemium users nor in revenue, early nor later in life (Figure 5 & 6).

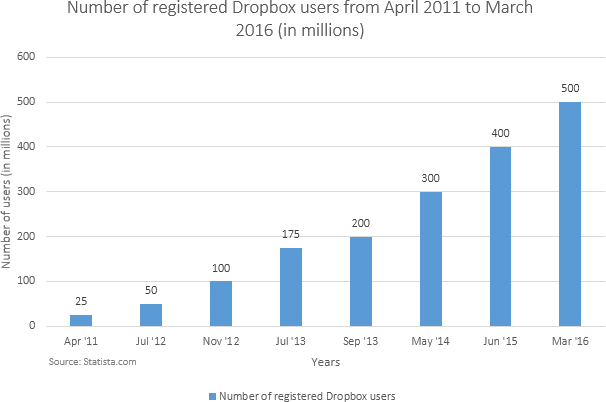
Figure 5: Early in life, Dropbox registered users grows non-exponentially, nearly exactly 100M per year


Figure 6: Later in life, Dropbox revenue grows linearly, and slows down
Trello grew fast too, getting to 10,000,000 registered users in three years. But not exponentially:

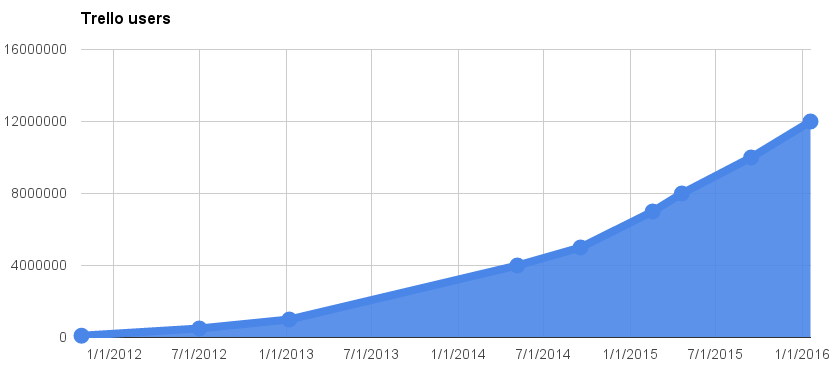
Figure 7
Lyft grew in part due to “network effects” according to their S1, but this chart they presented shows that active rider growth isn’t exponential:

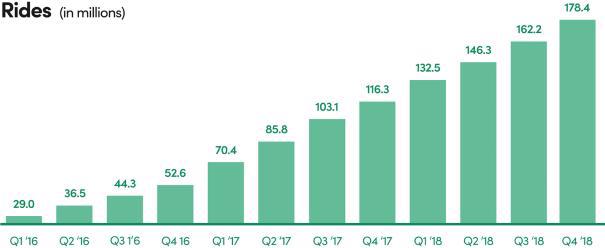
Figure 8
HubSpot’s revenue curve is astonishingly consistent, despite hitting multiple inflection points1 in their business:
1 e.g. launching new business models like selling through agencies instead of only directly, launching new product lines like sales CRM on top of marketing automation tools, and scaling the number of customers and employees by 10x

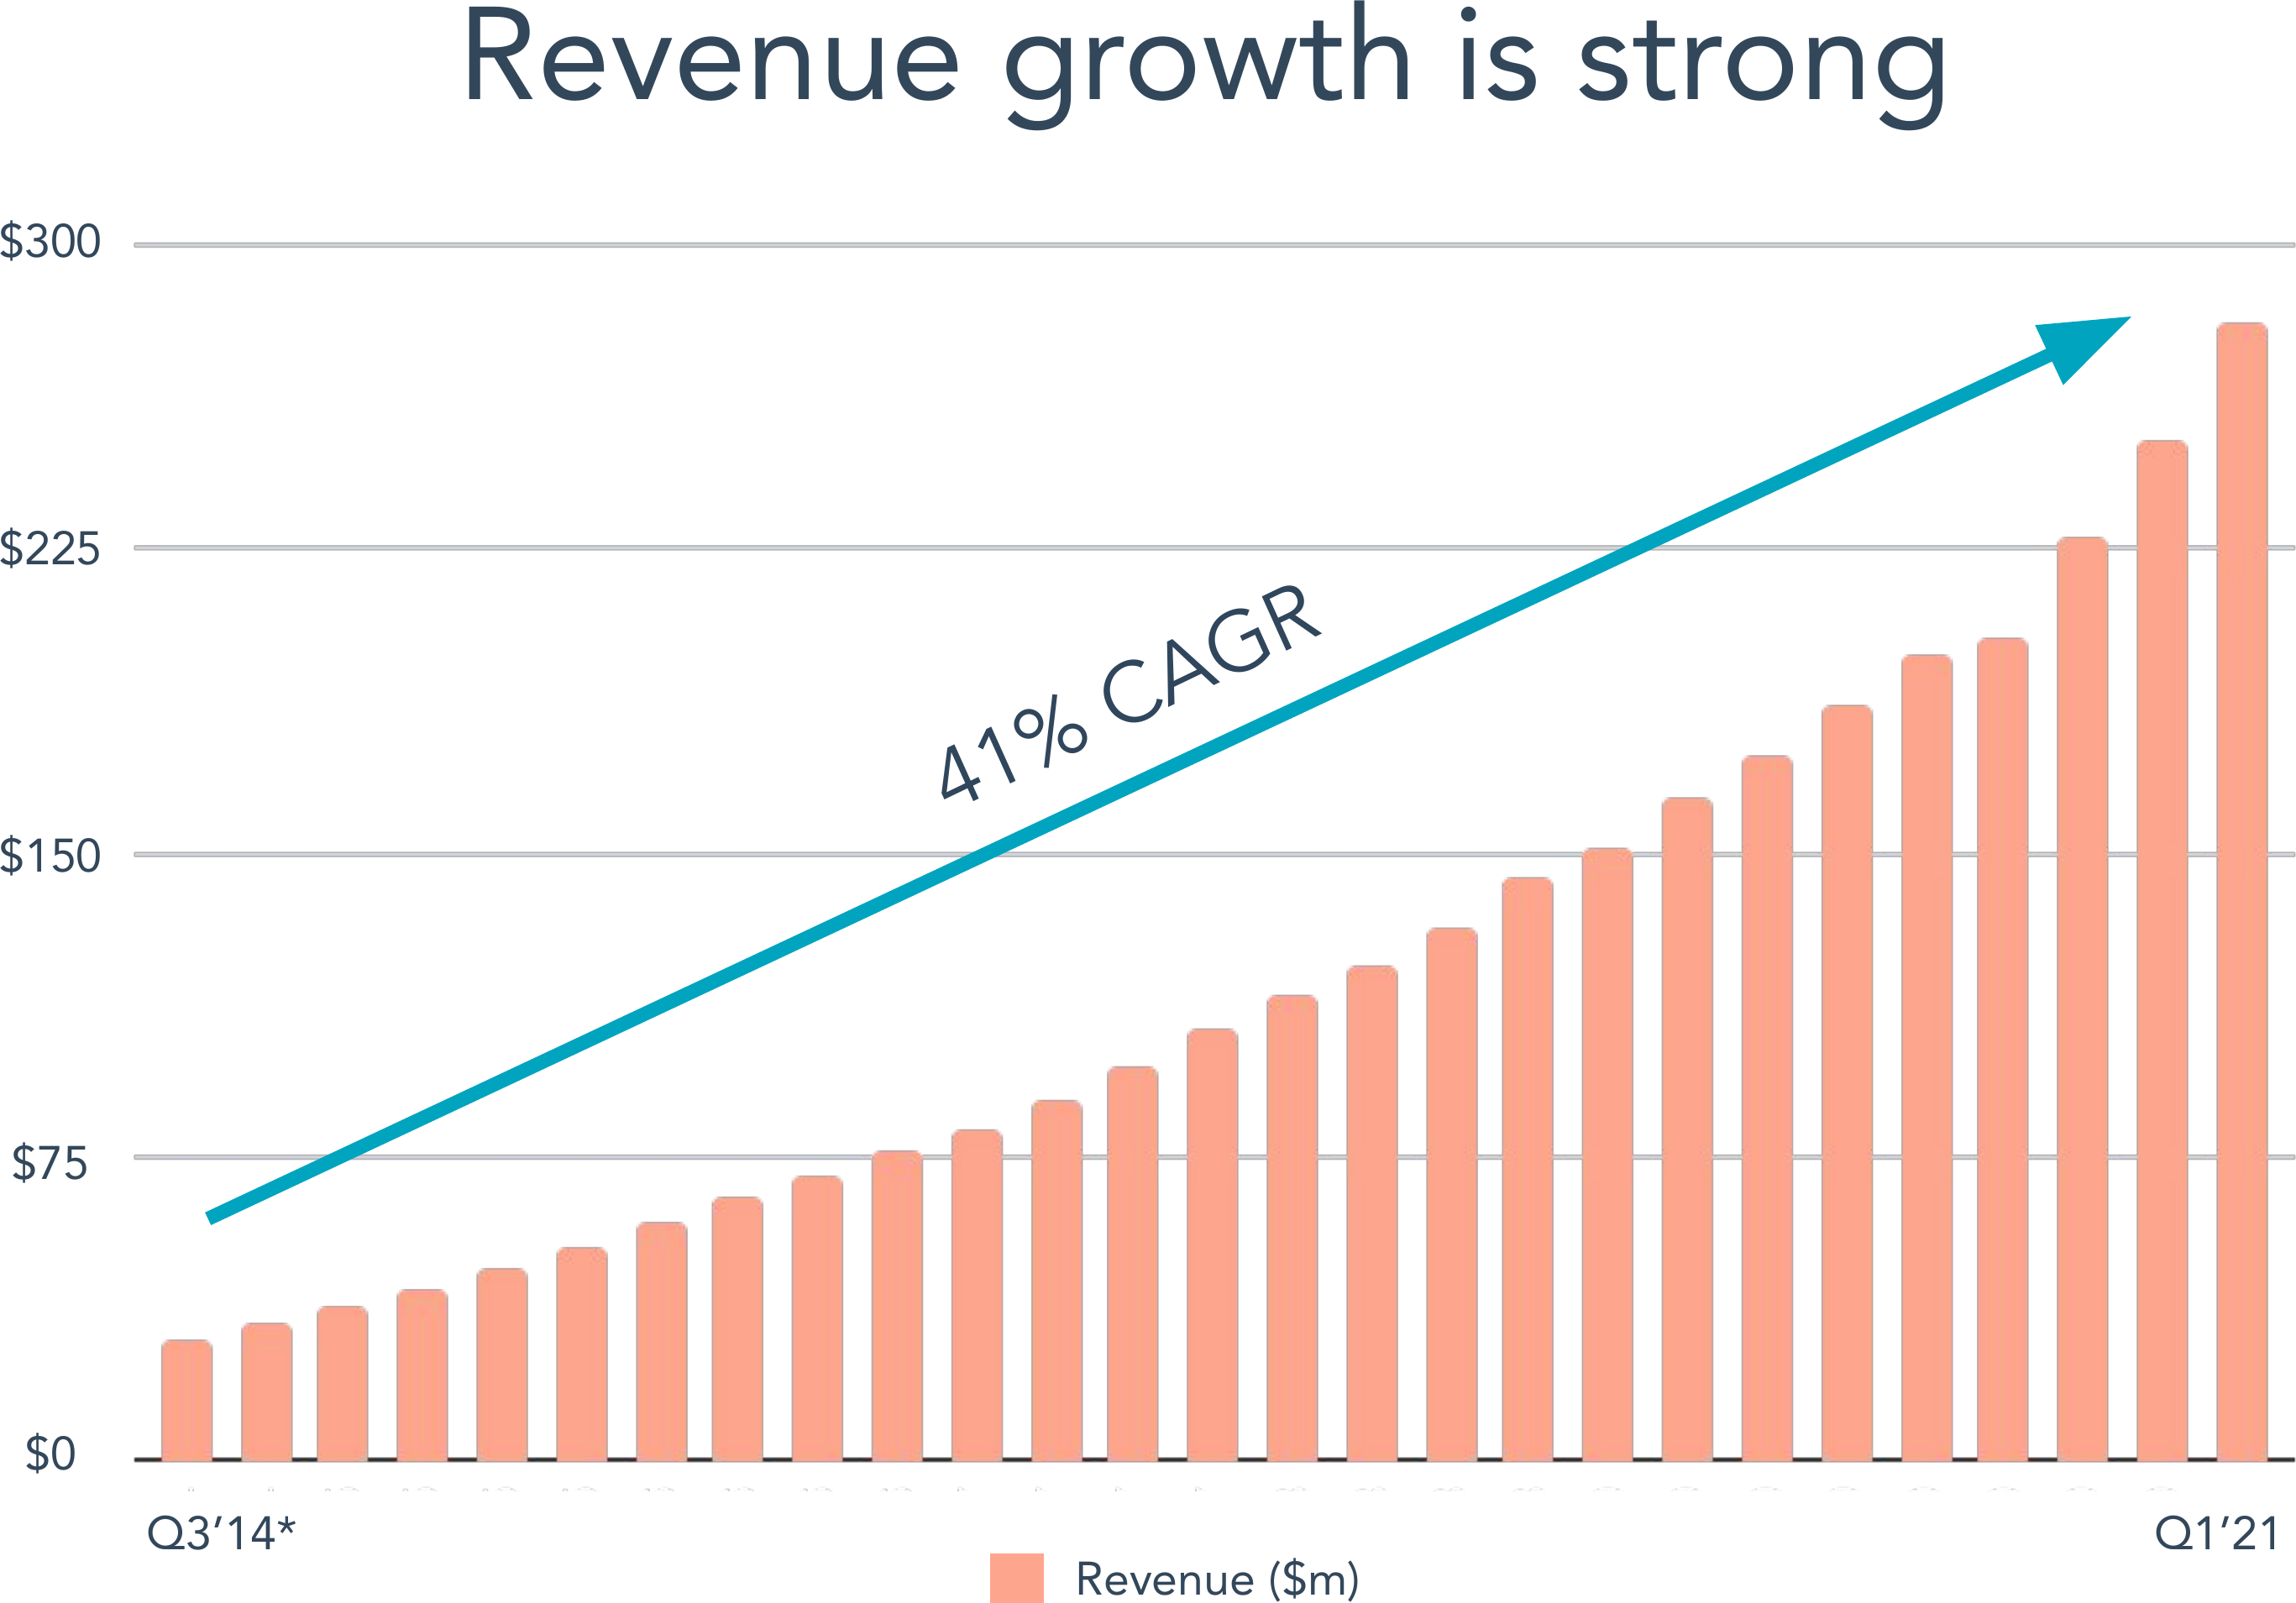
Figure 9
Analyzing this last example, we arrive at a new, non-exponential model.
Hypergrowth is quadratic
The language we use can determine the thoughts we have.
The HubSpot slide says “41% CAGR.” “CAGR” means annualized growth rate. They’re saying that if you start with the first number on the slide, then from there plot growing 41% per each year, compounding each year upon the previous, for seven years, you would arrive at the last number on the slide. This is exactly the definition of “exponential”—multiplying by a number repeatedly. In general when you use “CAGR” or “percentage growth” as a metric, you are implicitly saying “This is an exponential process.”
But HubSpot didn’t grow by 41% every year; in this time frame, it started at 60% and ended around 30%:

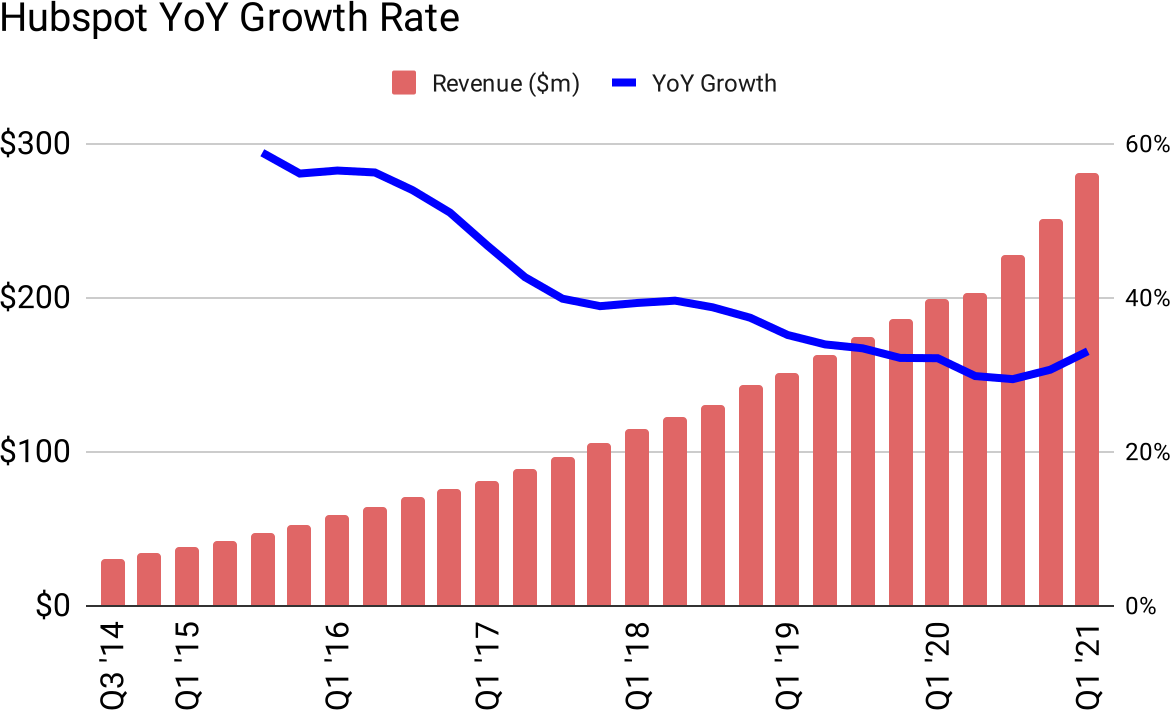
Figure 10: Exponential curves have a constant year-over-year growth rate, therefore this is not exponential growth.
If instead we examine growth in absolute dollars, rather than in percent, a pattern emerges. In the first set of four quarters on this report, they grew $17M. The next set grew $23M. Then $28M. Then $34M. Each year $5-7M more than the previous. This is the definition of a quadratic—adding an amount that increases by a constant amount each period, not multiplying.
Charting these year-over-year revenue differences in absolute dollars rather than in percent, it’s clear that indeed the changes were almost completely linear for years, then suddenly changed in 20202 to a new (but still linear) rate:
2 Coinciding with the launch of a new product: HubSpot CMS Hub.

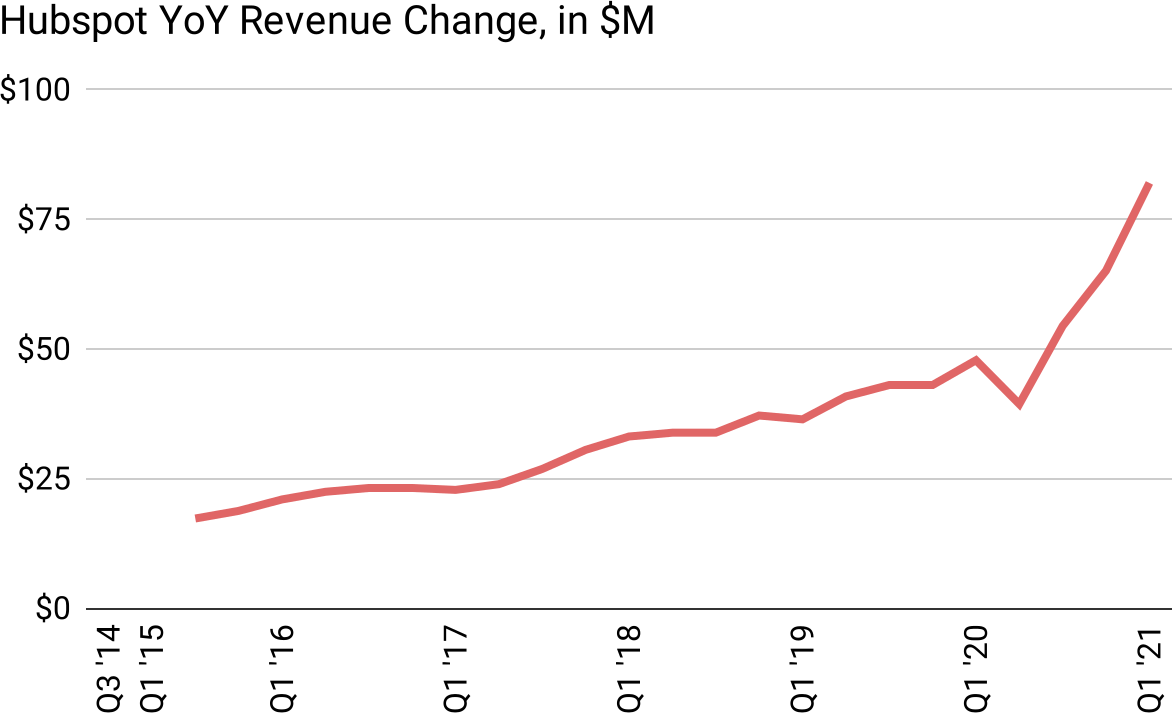
Figure 11
It is therefore mathematically inevitable that plotting a quadratic curve (rather than exponential) on top of HubSpot’s revenue data will be a perfect fit:

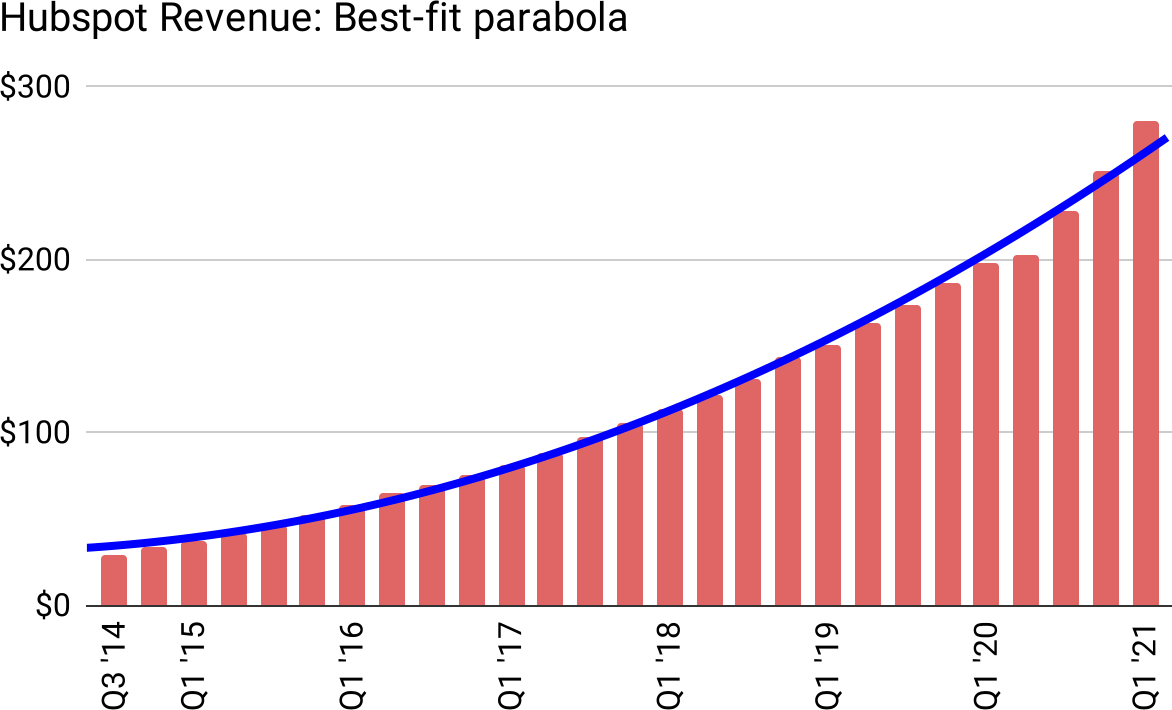
Figure 12: When you said “best-fit,” you weren’t kidding!
My thesis is that High-growth companies grow quadratically, not exponentially.3
3 My guess is low-growth companies are similar, but data are more easily available for the runaway-growth companies who publicly flaunt their success.
The consequence of this conclusion is important for operators and analysis and investors. These are all people trying to understand—and possibly change—growth drivers. Getting the right language, and the right model, will lead to right analysis, and right action.
Why marketing-driven products grow quadratically: A first-principles explanation
It’s not enough to draw best-fit lines on top of PowerPoint slides. We have to explain why this model makes sense, which in turn will create a better understanding of the growth drivers in our own companies.
We’ve been taking a macro view of growth, looking at multi-year trajectories. Now we’ll peer into the microscope instead of the telescope, and consider how growth arises from a single marketing campaign.
The life of a marketing campaign
In my experience, marketing campaigns follow this pattern:

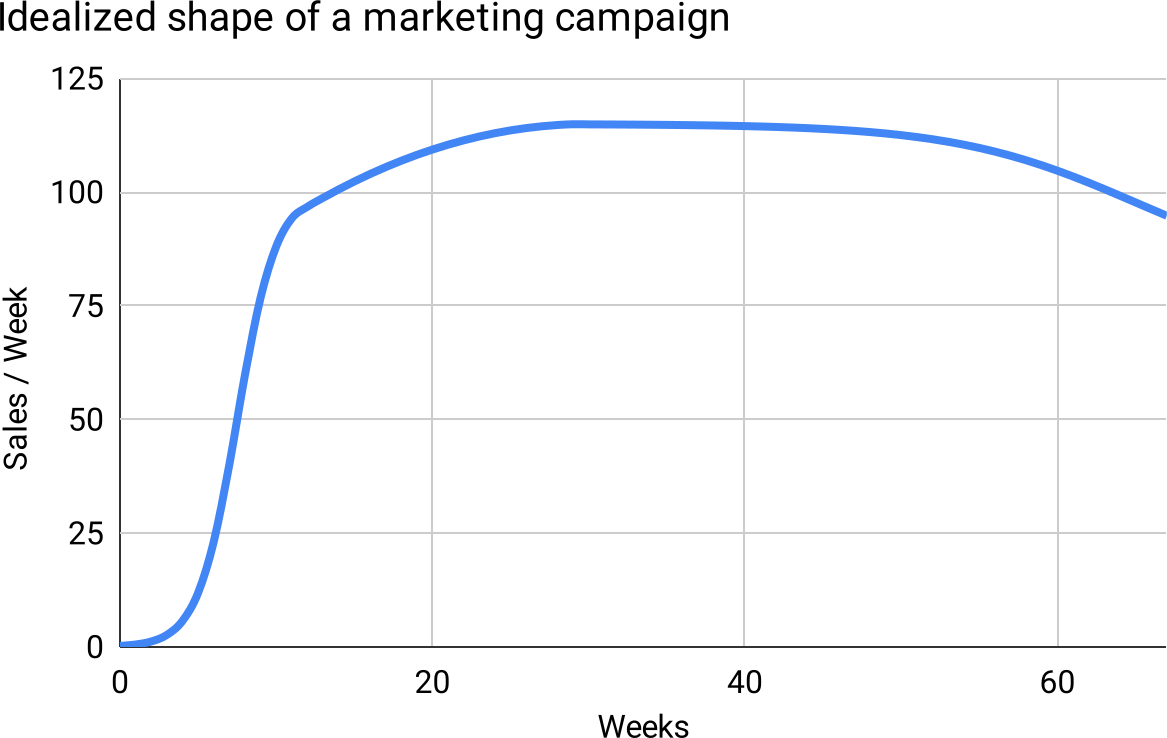
Figure 13
At the foot of the curve, we’ve launched a new campaign, but it’s ineffective; we haven’t figured out the best design and messaging and calls-to-action for this new medium and audience. Sometimes we never figure it out, and abandon the effort.4
4 It’s hard to distinguish (a) our failure to build effective copy and conversion funnels from (b) channels that are fundamentally a bad fit for our market or product. This uncertainty, together with the rapid evolution of digital marketing, suggests that we should retry campaigns in previously-failed channels every few years.
But in the case that we unlock the secret of efficacy, the campaign rapidly reaches a natural level of contribution; in this example, a number of “sales per week.” The specific level depends on many things: ad inventory, our budget, audience-receptivity, and the consonance between the audience and our target market.
Next we enter the optimization phase. We A/B Test our way to incrementally better results. Also we enjoy the result of multiple exposures—most people need to see the ad more than once before they act.
Finally we enter a phase of decline. There are various causes, all instructive:
- The audience saturates. Everyone in the channel has seen the ad more times than is required to act; it’s now falling on deaf ears. Even if the audience is growing, the number of new people is small compared to the number of people that were new-to-us when we began the campaign.
- The channel declines. A media site that was popular loses readers through over-monetization. An event that was well-attended loses favor. A newsletter that was frequent and insightful becomes less frequent or other writers take over. A podcast moves to a closed platform and loses many listeners.
- The auction becomes uneconomical. For auction-based systems like Google and Facebook advertisements, or other zero-sum programs like affiliates or limited-inventory spots on newsletters or podcasts, the winner is the one who will pay the most. What is cost-effective for one bidder will be laughably overpriced for another, due to better conversion rates, higher revenue per customer, higher profitability per customer, or due to categorization as a “loss leader” or other way of ascribing value beyond immediate pay-back.
This curve leads to actionable ideas for managing marketing (given at the end of this article), but also forms my central thesis about how all sorts of growth works at companies. So I’m giving it a name:

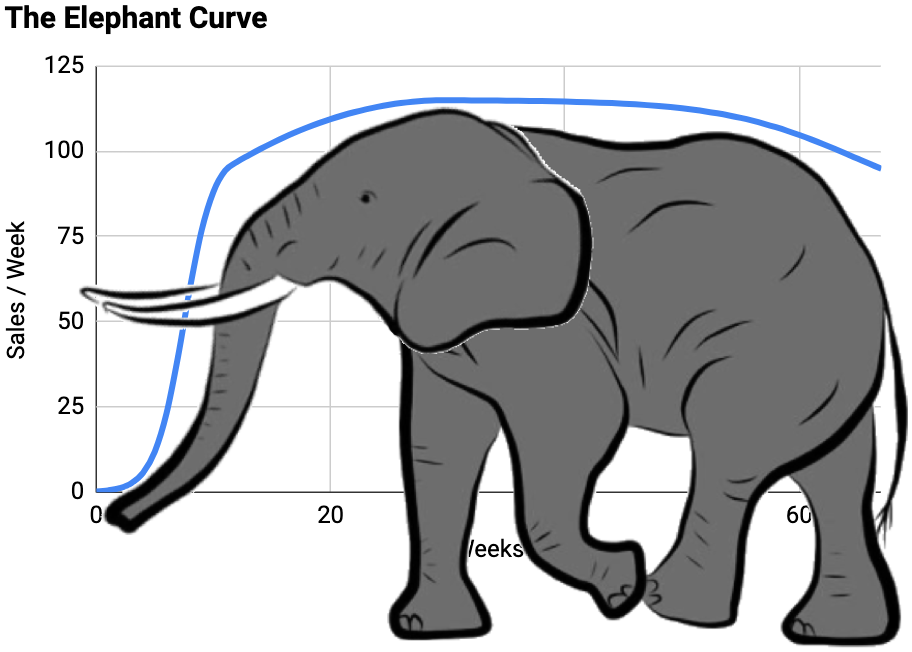
Figure 14
How the idealized marketing campaign converts to growth
The model above shows the number of sales per week the campaign contributes. To understand how this looks in terms of revenue growth, let us suppose a simple business model in which all sales are for a recurring revenue product generating $10 per month, with a 1% per month cancellation rate. Revenue grows over time in a certain way:

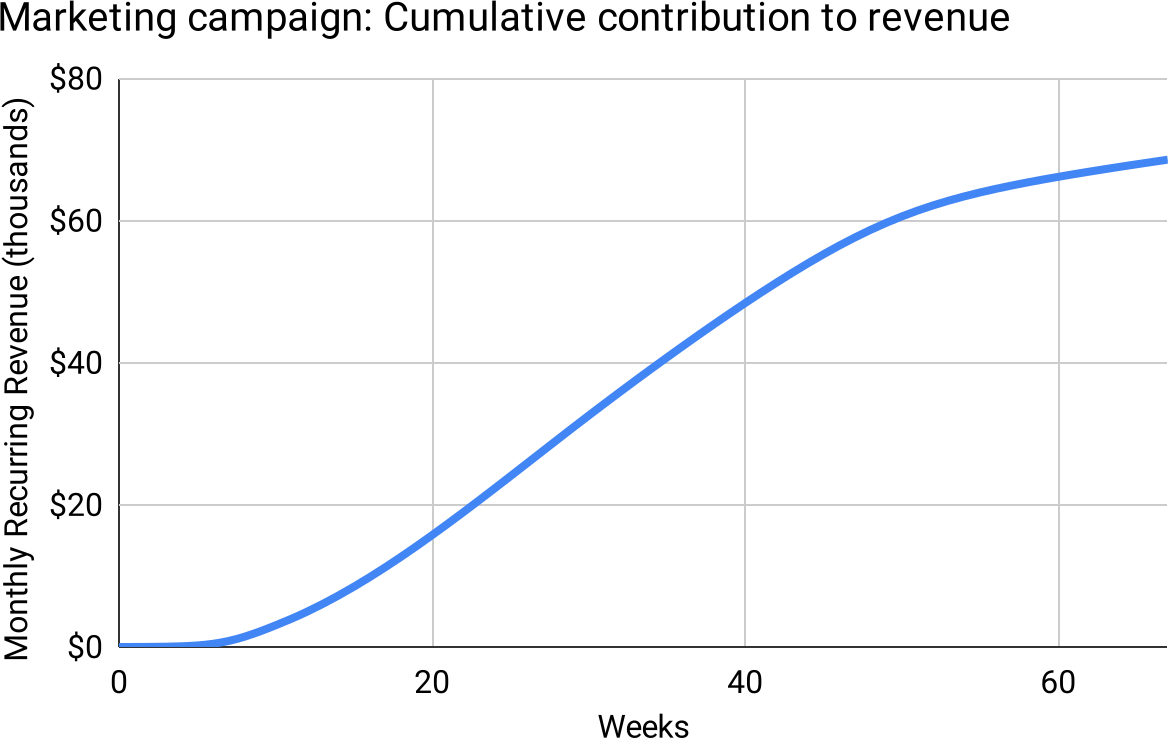
Figure 15
Growth initially accelerates as the campaign is solved, then grows roughly linearly as the campaign is optimized, and then starts sagging (although still growing!) as the campaign declines, and as the now-sizable customer base produces a non-trivial number of cancellations.
The layer-cake of quadratic growth
Marketing departments don’t stop at a single campaign. They add new ones. Some are bigger than others, some can be optimized more than others, some decline sooner than others, some decline more precipitously than others.
So, let’s model that: A variety of Elephant Curves, with differing parameters, beginning at different times, stacking the revenue-contribution of each to arrive at overall revenue growth for the company:

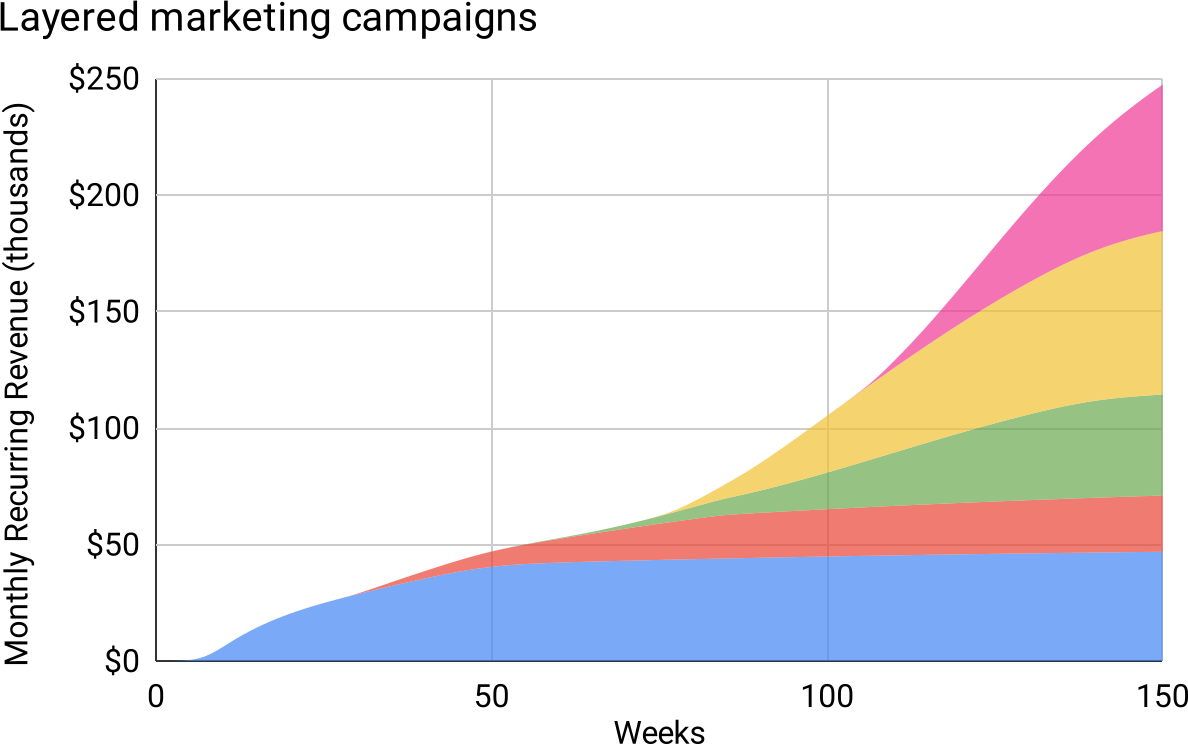
Figure 16: Layered campaigns create a “wavy quadratic.”
Scan your eye across the top of this kaleidoscopic cake, and you trace a wavy quadratic. This makes sense mathematically, because each campaign is essentially linear after it gets going, even if it sags during decline. “Adding more linear things over time” is the definition of a quadratic.
The reason it’s “wavy,” is that when we unlock a new campaign we get a burst of growth. Do real-life revenue curves exhibit this waviness? Maybe so; here’s another slide from the HubSpot deck:

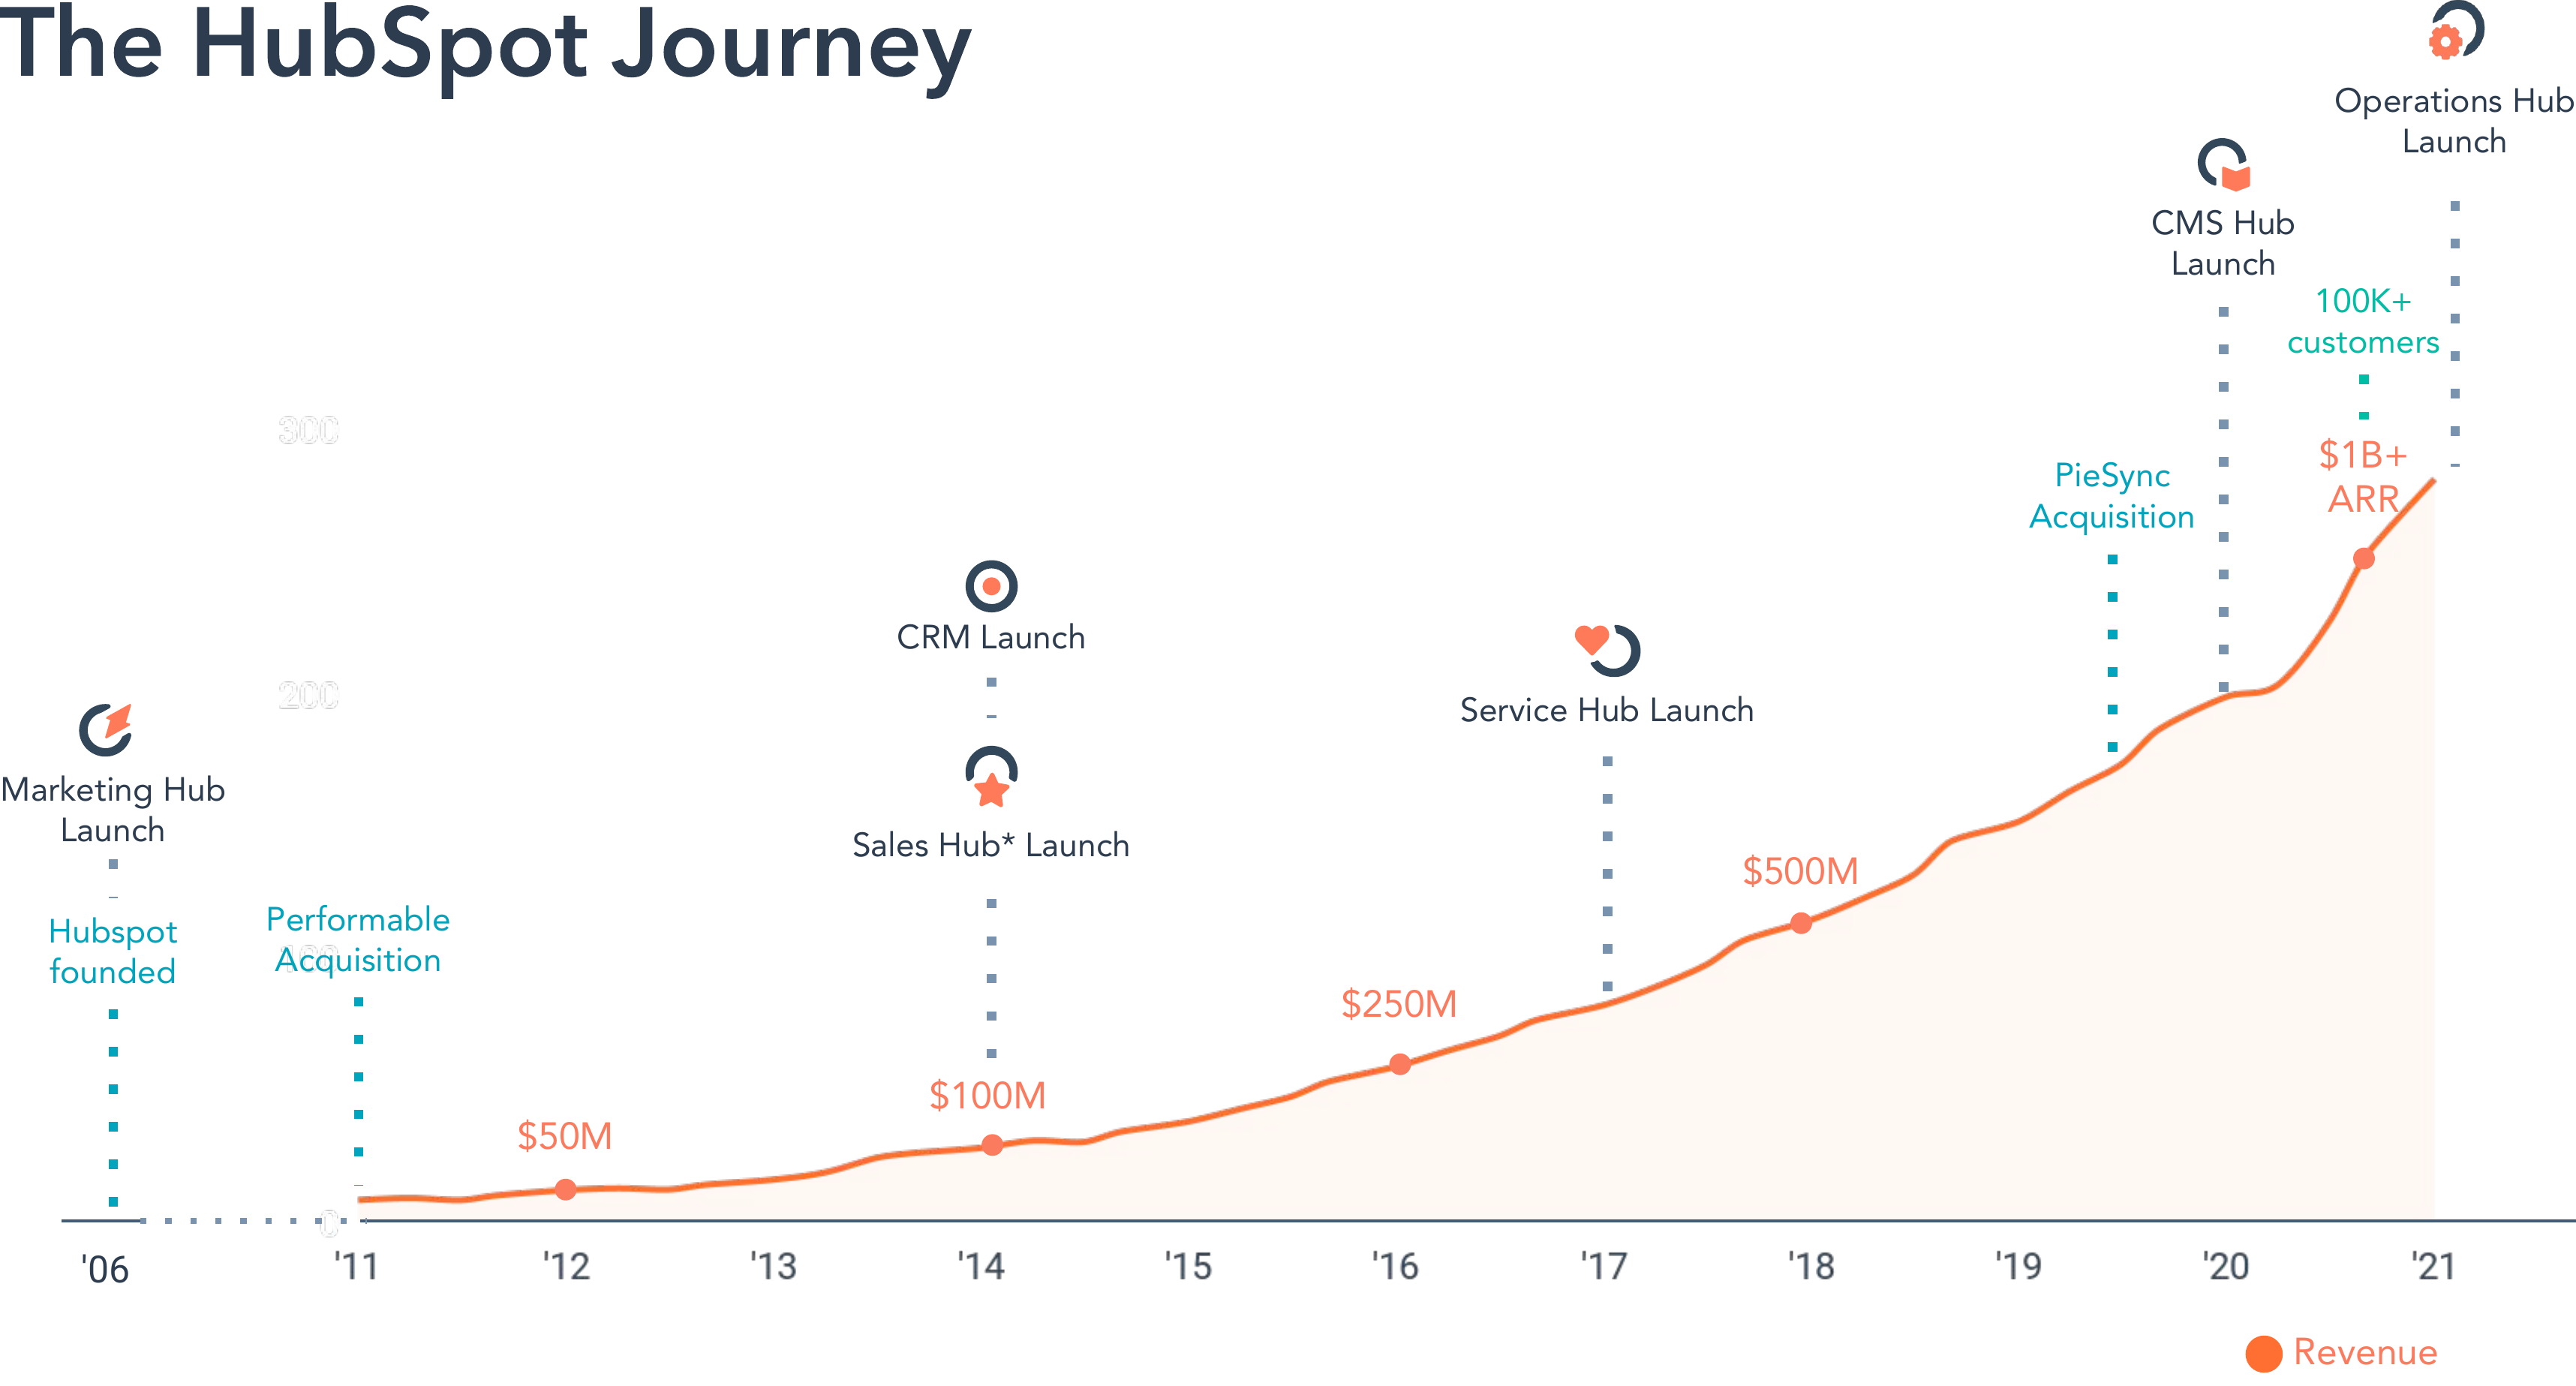
Figure 17
HubSpot didn’t just add new marketing channels, however, but also layered on new geographies and new products. Do those activities have the same effect as marketing campaigns?
Multiple product lines at marketing-driven companies: Still quadratic
So far we’ve assumed a single product, driven by marketing campaigns. High-growth companies who want to continue growing quickly after their first product reaches scale, must launch new products into new markets.
Is the Elephant Curve also the shape of an entire product line? After all, products often have an initial slow-growth period (because only cutting-edge early adopters are eager to pay to “be first” with bugs and missing features), followed by a faster expansion period, then reach some sort of natural ceiling, and possibly enter a period of decline (as the market evolves or competition overwhelms).
Indeed, this is what we see with many products, especially those that are marketing-driven, and without recurring-revenue. iPod sales, for example, are a perfect match:

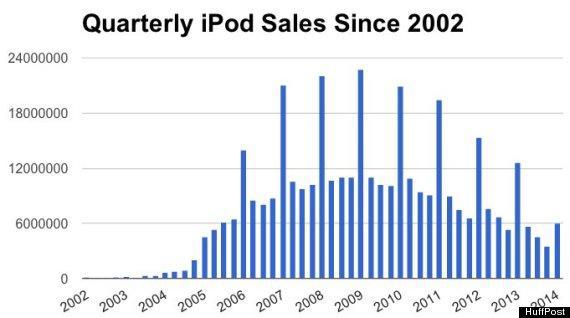
Figure 18
It should therefore be unsurprising when we look at the overall revenue chart for Apple, and once again see quadratic growth on the top-line, admittedly with a special one-time bump for the unprecedented5 success of the iPhone:
5 It is rare for a second product to dramatically outpace the first; even juggernauts like Google, Amazon, and Facebook never achieved that.

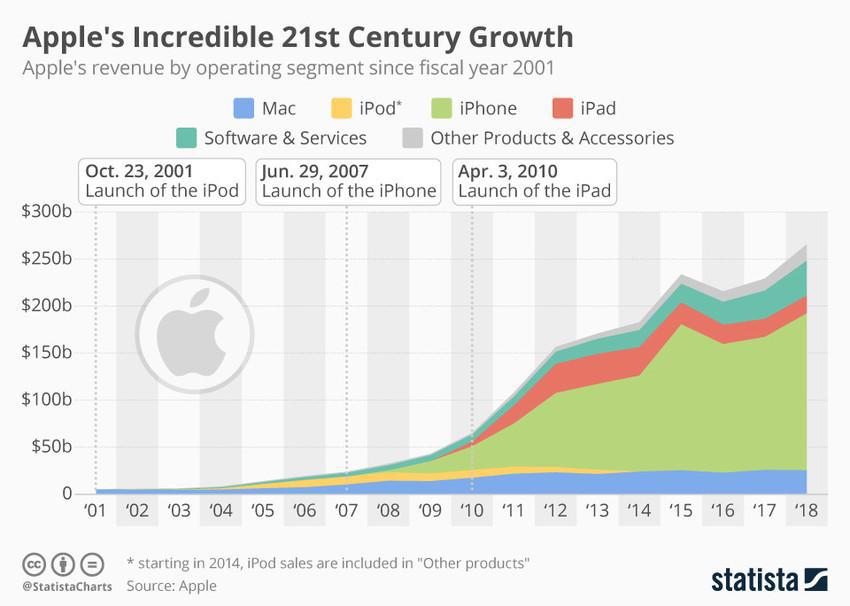
Figure 19
Each product is in a different phase of its lifecycle: The iPod declined to zero, the iPad is still declining; Macs are teetering but essentially flat; iPhones and software services are still increasing.
The quadratic explanation for “growth decay”
It’s well-known that growth—as a percentage—naturally declines with scale, even when there’s nothing wrong with the company.
This law of nature has been given a name: Growth Decay (or sometimes Growth Persistence). Because of the traditional insistence of talking about growth as a percentage, the concept is articulated this way: If a company grew X% last year, it’s likely to grow a bit less than X% this year. With this formulation, the question becomes: How much less?
The data give us the answer of 85%, although with  , this is a tendency but far from a law:

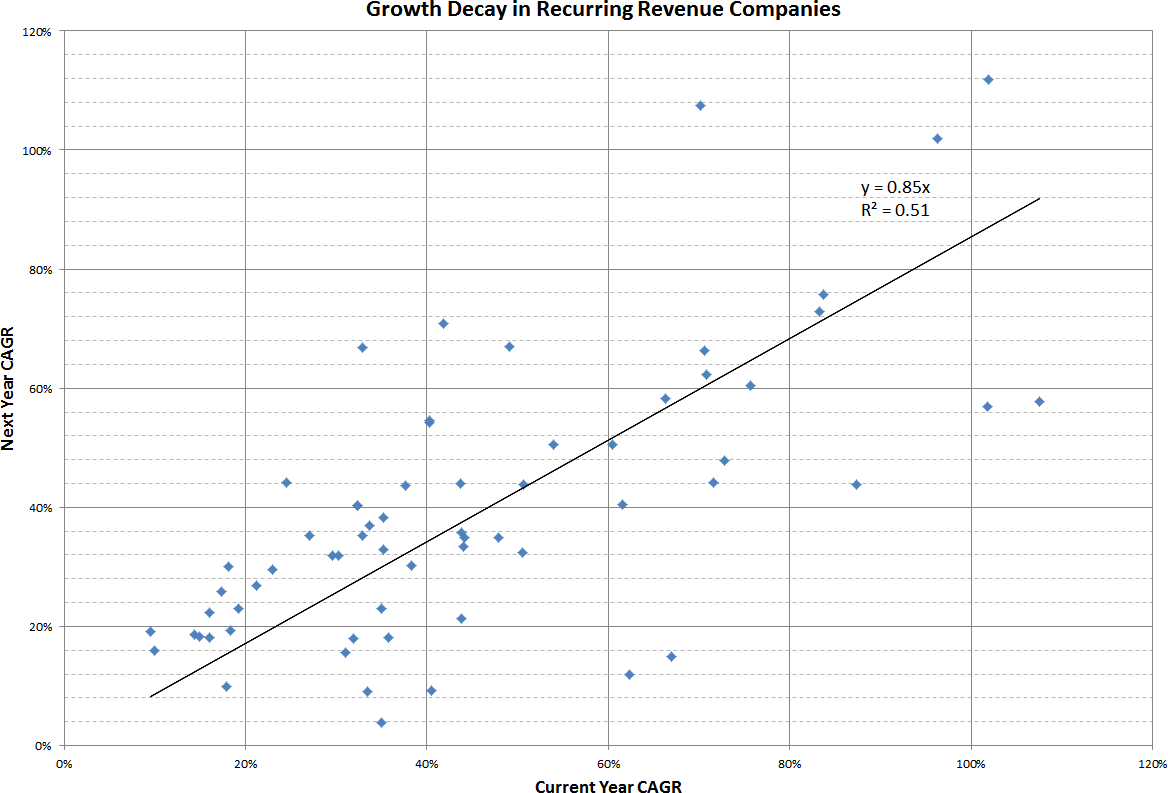
Figure 20
With our new appreciation that growth isn’t exponential, and therefore “percentage” might be the wrong way to characterize growth, we could ask what curve would best model the idea of Growth Decay? Specifically, let’s plot revenue for an initially-fast-growing company that is subject to the principle of Growth Decay:

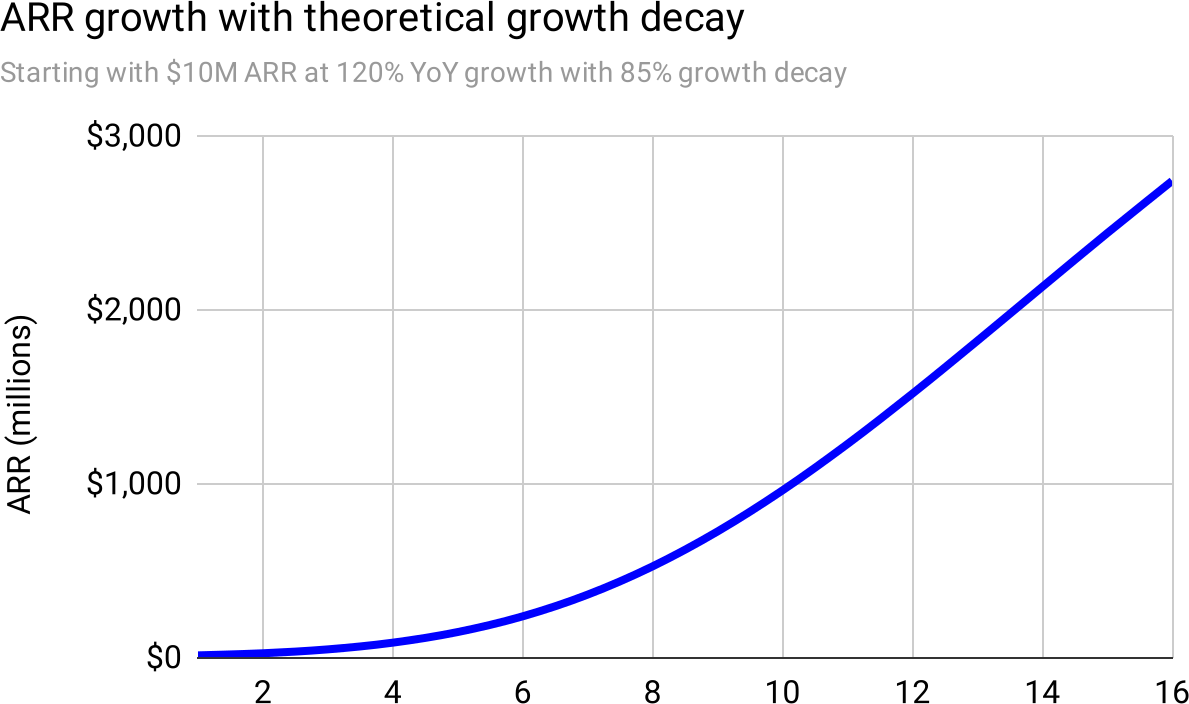
Figure 21
The first sixteen years of the curve is quadratic. While mathematically not identical, the best-fit quadratic curve6 has a staggering %22%3E%3Cg%20data-mml-node=%22math%22%3E%3Cg%20data-mml-node=%22mstyle%22%3E%3Cg%20data-mml-node=%22TeXAtom%22%20data-mjx-texclass=%22ORD%22%3E%3Cg%20data-mml-node=%22msup%22%3E%3Cg%20data-mml-node=%22mi%22%3E%3Cpath%20data-c=%221D445%22%20d=%22M230%20637q-27%200-32%201t-5%2011q0%2027%2011%2033%202%201%20174%201%20172-1%20186-3%2056-8%2094-28t54-46%2021-43%206-34q0-45-29-84t-67-60-67-34-38-13l7-5q67-38%2067-110%200-11-5-61t-5-82V71q0-18%201-28t11-18%2026-9q28%200%2046%2022t26%2047q5%2014%208%2017t15%203q20%200%2020-12%200-18-24-57-38-57-90-57h-9Q571-21%20531%204T487%2082q0%2027%2015%2084t15%2073q0%2051-43%2074-15%207-25%208t-71%202H309L277%20193Q244%2061%20244%2059q0-4%201-5t7-4%2017-2%2033-2h31q6-8%206-9t-3-18Q332%206%20326%200H311Q275%202%20180%202q-34%200-63%200T71%202%2050%201Q33%201%2033%2010q0%202%203%2014%205%2019%2010%2021%204%201%2015%201h6q27%200%2060%203%2014%203%2019%2012%203%204%2072%20278t69%20289q0%207-57%209zm4e2-83q0%2032-21%2054t-86%2028q-2%200-23%200t-38%201H440q-47%200-54-10-1-3-34-133T319%20361q0-1%2069-1%2078%201%20104%207%2064%2010%201e2%2059%2016%2023%2027%2060t11%2068z%22/%3E%3C/g%3E%3Cg%20data-mml-node=%22mn%22%20transform=%22translate(792,363)%20scale(0.707)%22%3E%3Cpath%20data-c=%2232%22%20d=%22M109%20429q-27%200-43%2018T50%20491q0%2071%2053%20123t132%2052q91%200%20152-56t62-145q0-43-20-82t-48-68-80-74q-36-31-1e2-92L142%2093l76-1q157%200%20167%205%207%202%2024%2089v3h40v-3q-1-3-13-91T421%203V0H50V19%2031q0%207%206%2015T86%2081q29%2032%2050%2056%209%2010%2034%2037t34%2037%2029%2033%2028%2034%2023%2030%2021%2032%2015%2029%2013%2032%207%2030%203%2033q0%2063-34%20109t-97%2046q-33%200-58-17t-35-33-10-19q0-1%205-1%2018%200%2037-14t19-46q0-25-16-42t-45-18z%22/%3E%3C/g%3E%3C/g%3E%3Cg%20data-mml-node=%22mo%22%20transform=%22translate(1473.3,0)%22%3E%3Cpath%20data-c=%223D%22%20d=%22M56%20347q0%2013%2014%2020H707q15-8%2015-20%200-11-14-19l-318-1H72q-16%205-16%2020zm0-194q0%2015%2016%2020H708q14-10%2014-20%200-13-15-20H70q-14%207-14%2020z%22/%3E%3C/g%3E%3Cg%20data-mml-node=%22mn%22%20transform=%22translate(2529.1,0)%22%3E%3Cpath%20data-c=%2230%22%20d=%22M96%20585q56%2081%20153%2081%2048%200%2096-26t78-92q37-83%2037-228%200-155-43-237-20-42-55-67T301-15t-51-7q-26%200-52%206T137%2016%2082%2083Q39%20165%2039%20320q0%20174%2057%20265zm225%2012q-30%2032-71%2032-42%200-72-32-25-26-33-72t-8-192q0-158%208-208t36-79q28-30%2069-30%2040%200%2068%2030%2029%2030%2036%2084t8%20203q0%20145-8%20191t-33%2073z%22/%3E%3Cpath%20data-c=%222E%22%20d=%22M78%2060q0%2024%2017%2042t43%2018q24%200%2042-16t19-43q0-25-17-43T139%200%2096%2017%2078%2060z%22%20transform=%22translate(500,0)%22/%3E%3Cpath%20data-c=%2239%22%20d=%22M352%20287q-48-76-120-76-78%200-128%2059T44%20396q-2%2016-2%2040v8q0%2093%2069%20162%2060%2060%20132%2060%202%200%206%200t8-1h4q12%200%2025-2t37-12%2047-32%2043-59q43-88%2043-226%200-140-60-237-35-56-84-87T208-22Q147-22%20108%207T68%2093t53%2056q22%200%2037-14t15-39q0-18-9-31T148%2049t-13-5l-4-1q0-2%207-6t26-10%2042-5h6q60%200%20101%2064%2039%2056%2039%20194v7zM244%20248q48%200%2077%2049t30%20133q0%2078-8%20112-2%2010-6%2020t-14%2026-30%2027-47%2010q-38%200-65-27-21-22-27-52t-7-105q0-83%205-112t20-47q25-34%2072-34z%22%20transform=%22translate(778,0)%22/%3E%3Cpath%20data-c=%2239%22%20d=%22M352%20287q-48-76-120-76-78%200-128%2059T44%20396q-2%2016-2%2040v8q0%2093%2069%20162%2060%2060%20132%2060%202%200%206%200t8-1h4q12%200%2025-2t37-12%2047-32%2043-59q43-88%2043-226%200-140-60-237-35-56-84-87T208-22Q147-22%20108%207T68%2093t53%2056q22%200%2037-14t15-39q0-18-9-31T148%2049t-13-5l-4-1q0-2%207-6t26-10%2042-5h6q60%200%20101%2064%2039%2056%2039%20194v7zM244%20248q48%200%2077%2049t30%20133q0%2078-8%20112-2%2010-6%2020t-14%2026-30%2027-47%2010q-38%200-65-27-21-22-27-52t-7-105q0-83%205-112t20-47q25-34%2072-34z%22%20transform=%22translate(1278,0)%22/%3E%3Cpath%20data-c=%2239%22%20d=%22M352%20287q-48-76-120-76-78%200-128%2059T44%20396q-2%2016-2%2040v8q0%2093%2069%20162%2060%2060%20132%2060%202%200%206%200t8-1h4q12%200%2025-2t37-12%2047-32%2043-59q43-88%2043-226%200-140-60-237-35-56-84-87T208-22Q147-22%20108%207T68%2093t53%2056q22%200%2037-14t15-39q0-18-9-31T148%2049t-13-5l-4-1q0-2%207-6t26-10%2042-5h6q60%200%20101%2064%2039%2056%2039%20194v7zM244%20248q48%200%2077%2049t30%20133q0%2078-8%20112-2%2010-6%2020t-14%2026-30%2027-47%2010q-38%200-65-27-21-22-27-52t-7-105q0-83%205-112t20-47q25-34%2072-34z%22%20transform=%22translate(1778,0)%22/%3E%3C/g%3E%3C/g%3E%3C/g%3E%3C/g%3E%3C/g%3E%3C/svg%3E) .
.
6when fit perfectly; interestingly this is very close to
, showing how simple the curve really is.
This is yet another signal that quadratic growth is the correct model.
Beyond marketing campaigns: “Viral” and other forms of “exponential” growth
But some products really do grow exponentially. In theory.
In theory, theory and practice are the same. In practice, they’re not.7
7 This phrase attributed to Benjamin Brewster.
Some products don’t grow proportionally with marketing and sales, but instead self-propel with a mechanism that theoretically ought to be exponential. There are at least three ways for this to happen:
- Type 1: Virality
- When each user invites on average another
 users, then each of those new users bring in another new users, so we end up with
  more. Then each of those brings in another which yields
 %22%3E%3Cg%20data-mml-node=%22math%22%3E%3Cg%20data-mml-node=%22mstyle%22%3E%3Cg%20data-mml-node=%22TeXAtom%22%20data-mjx-texclass=%22ORD%22%3E%3Cg%20data-mml-node=%22msup%22%3E%3Cg%20data-mml-node=%22mi%22%3E%3Cpath%20data-c=%221D44E%22%20d=%22M33%20157q0%20101%2076%20192t171%2092q51%200%2090-49%2016%2030%2046%2030%2013%200%2023-8t10-20q0-13-37-160T374%2068q0-25%207-33t21-9q9%201%2020%209%2021%2020%2041%2096%206%2020%2010%2021%202%201%2010%201h4q19%200%2019-9%200-6-5-27T481%2063%20449%2013Q436%200%20417-8q-8-2-24-2-34%200-57%2015T306%2036l-6%2015q-1%201-4-1-2-2-4-4-59-56-120-56-55%200-97%2040T33%20157zM351%20328q0%206-5%2022t-23%2035-46%2020q-35%200-67-31t-50-81q-29-79-41-164%200-3%200-11t-1-12q0-45%2018-62t43-18q38%200%2075%2033t44%2051q2%204%2027%20107t26%20111z%22/%3E%3C/g%3E%3Cg%20data-mml-node=%22mn%22%20transform=%22translate(562,363)%20scale(0.707)%22%3E%3Cpath%20data-c=%2233%22%20d=%22M127%20463q-27%200-42%2017T69%20524q0%2055%2048%2098t116%2043q35%200%2044-1%2074-12%20113-53t40-89q0-52-34-101t-94-71l-3-2q0-1%209-3t29-9%2038-21q82-53%2082-140%200-79-62-138T238-22q-80%200-138%2043T42%20130q0%2028%2018%2045t45%2018q28%200%2046-18t18-45q0-11-3-20t-7-16-11-12-12-8-10-4-8-3l-4-1q51-45%20124-45%2055%200%2083%2053%2017%2033%2017%20101v20q0%2095-64%20127-15%206-61%207l-42%201-3%202q-2%203-2%2016%200%2018%208%2018%2028%200%2058%205%2034%205%2062%2042t28%20112v8q0%2057-35%2079-22%2014-47%2014-32%200-59-11t-38-23-11-12h3q3-1%208-2t10-5%2012-7%2010-11%208-15%203-20q0-22-14-39t-45-18z%22/%3E%3C/g%3E%3C/g%3E%3C/g%3E%3C/g%3E%3C/g%3E%3C/g%3E%3C/svg%3E) . Then
. Then  and so on; this is the definition of exponential growth. Biological viruses grow exponentially for a similar reason, justifying the label.
Examples: social media, chat clients, peer-to-peer payment platforms, massively-multi-player games, fantasy sports leagues. - Type 2: Word-of-Mouth
- All products have some word-of-mouth component, but here we’re referring to products that are primarily driven this way; this creates a growth process that is similar to viral. Typically the mechanism of “telling others” is built into the product, rather than bolted on by marketing or generated by goodwill. The difference between “word-of-mouth” and “viral,” is that viral products are unusable unless you invite others to become users (thus exponential growth is enforced) whereas word-of-mouth products encourage sharing. Thus chat clients are viral because without inviting others you can’t chat, whereas Wordle8 was word-of-mouth, because you play the game alone, but are encouraged to share results on Twitter, which in turn brings in new users.
Examples: gamified products that generate significant sharing (self-improvement, game-results), consumer-to-consumer marketplaces where being a buyer plants the idea of becoming a seller (eBay, Airbnb, Uber); organizations with a cause that creates on-going buzz (brazenly unique cultures, a passionate higher purpose, something people feel is linked to their personal identity). - Type 3: Hot Trend
- Products that “everyone” (in some well-defined market) is going to buy. For smartphones, that might be half the population of the world. For internet search, that might be 100% of the online world. For backend management systems for large hospital chains, that could be 1000 potential customers. These products hit “tipping points” where “suddenly everyone buys it.” Even if, like internet search, the product has no explicitly viral nor word-of-mouth component—when you search on Google, you don’t “invite friends” to also search on Google—the ubiquity and inevitability of the trend leads to an explosion of users.
Examples: word-processing, spreadsheets, broadband internet, the smartphone, the shifts to cloud computing and online shopping, major media delivery platforms of radio, TV, DVD, and video streaming.
8 Wordle exploded from 90 players in November 2021, to 300,000 in December, to 2,000,000 in January, when it was bought by the New York Times.
Logistic growth: Nearly the right model for virality
Products cannot grow forever, for the obvious reason that markets are finite. The Facebook virus spread to billions of people, but not infinite. Smartphones have been purchased by billions of people, but not infinite.
Therefore, even if “exponential” is the correct model for the core growth mechanism of the product, it nevertheless cannot continue growing exponentially because it runs out of market. Furthermore, markets tend to have so-called “low-hanging fruit”—customers who are more eager to buy—so although the virus spreads exponentially through these easy-pickings, it runs into the majority of people who will buy, but maybe later, maybe after more of their friends or competitors are using it, maybe if it’s less expensive, maybe once it has more features, maybe once it supports integration with specific other software, and all manner of other excuses. The virus has more trouble infecting these high-strung fruits, so growth slows.
This suggests a curve that starts exponentially, but then slows as it runs into the soft back-pressure of more demanding customers, and finally flattens out completely as it runs into the hard limit of the size of the addressable market.
Biologists have already done the work for us, because this is the correct model not just for viral products, but biological viruses infecting a population—akin to product types 1 and 2 above. Intriguingly, this is also the correct model9 for the diffusion of a gas across a membrane—akin to product type 3. The mathematical model for all of these processes is the logistic curve:
9 The similarity is that in both cases you have a sudden demand that enters into a new space, but which slows and eventually stops as the new space becomes saturated.

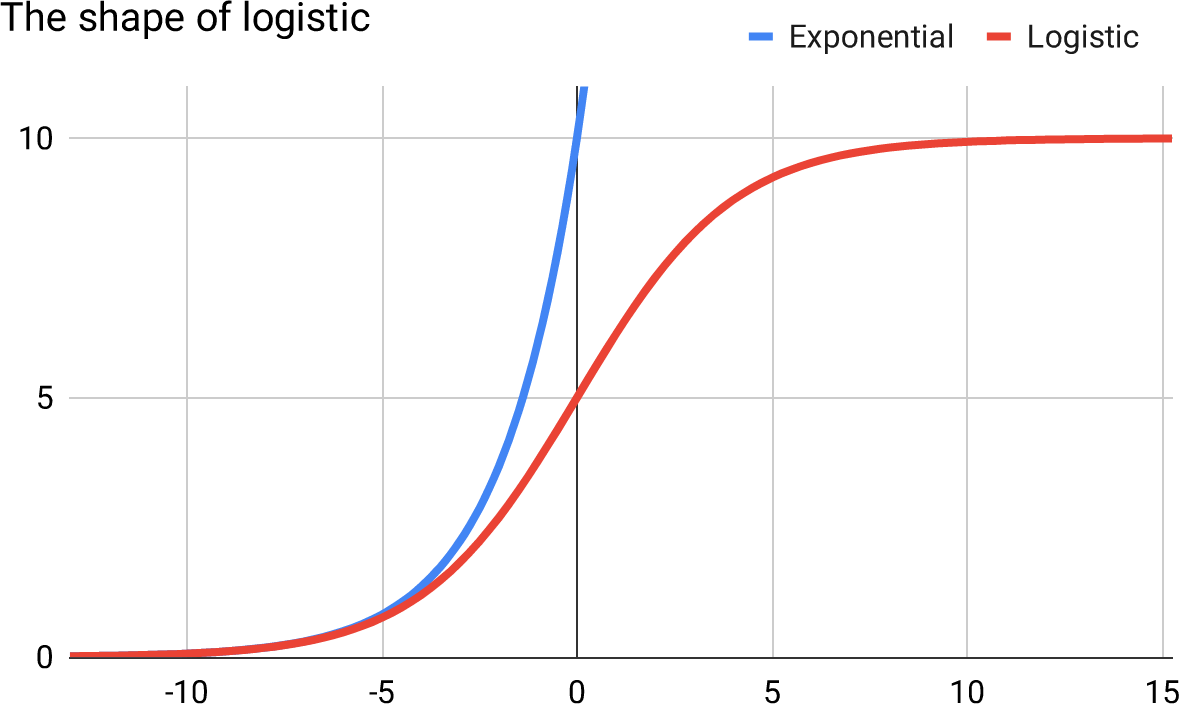
Figure 22
The logistic curve is exponential in the early days when it is far away from its natural limit. As the product (or gas or virus) gets to around 25% market penetration (or infections or saturation), the curve flattens into linear growth, in a tension between the exponential force of growth, countered by fewer and more demanding remaining targets. Finally it levels out at what is called the “carrying capacity”—the fully-saturated market.
The logistic curve is evident in the real world, in all three product types (Figure 23 & 24 & 25 & 26 & 27 & 28 & 29).

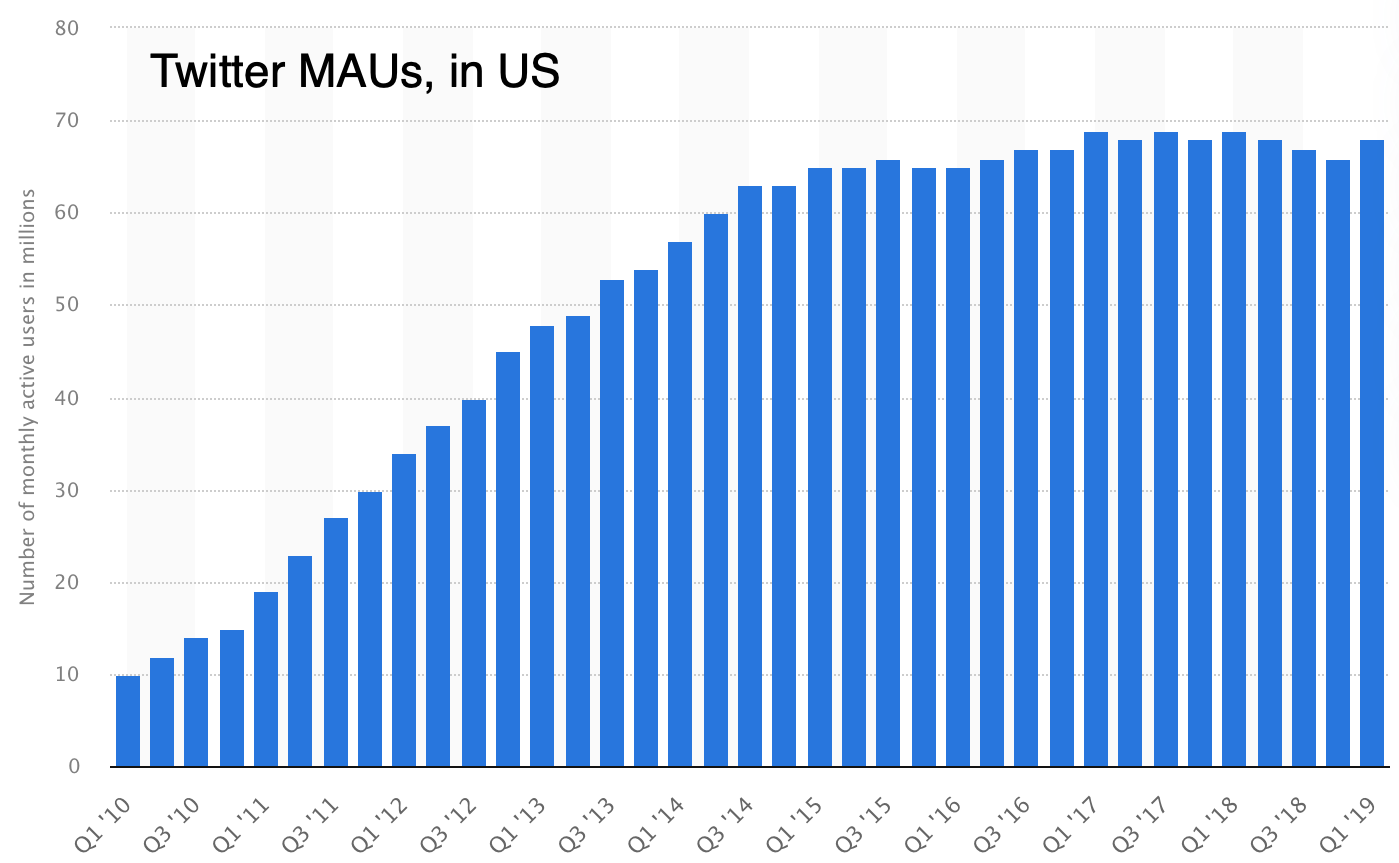
Figure 23: Twitter is a type 1 “Viral” product that follows the logistic model

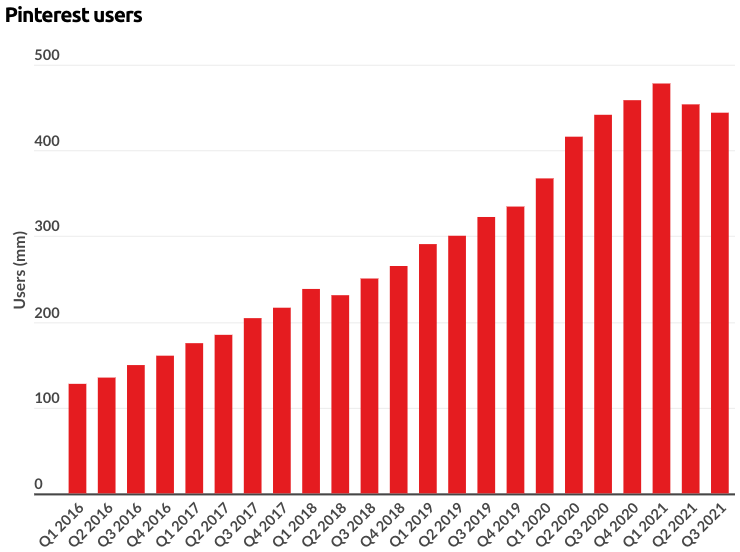
Figure 24: Pinterest is a type 1 “Viral” product that follows the logistic model

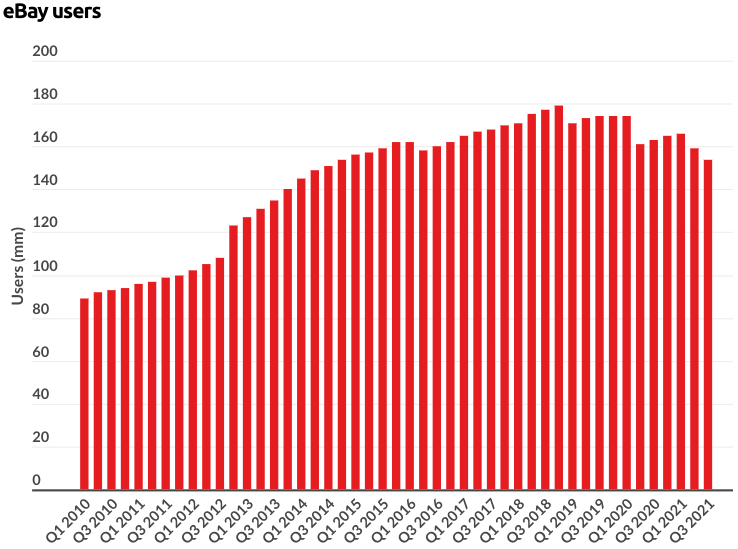
Figure 25: eBay is a type 2 “Word-of-mouth” in the number of buyers, following the logistic model (though also sagging towards the end, reminiscent of the Elephant Curve)

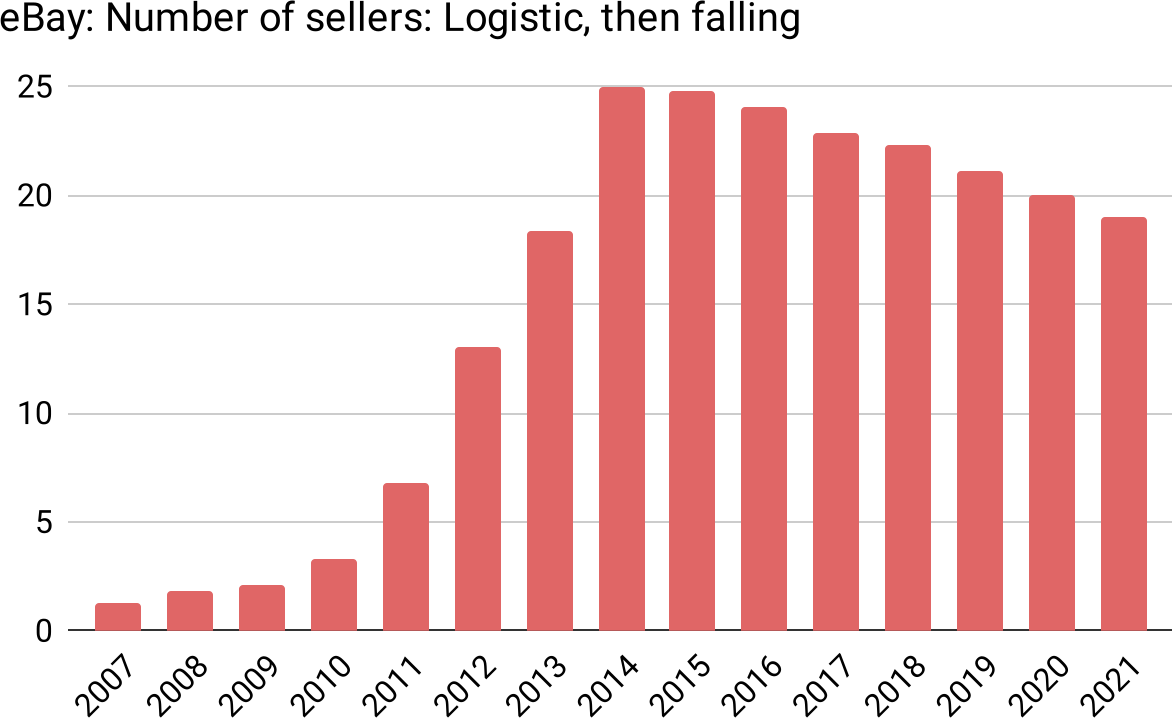
Figure 26: eBay also follows the logistic model in the number of sellers (with even more pronounced sagging)

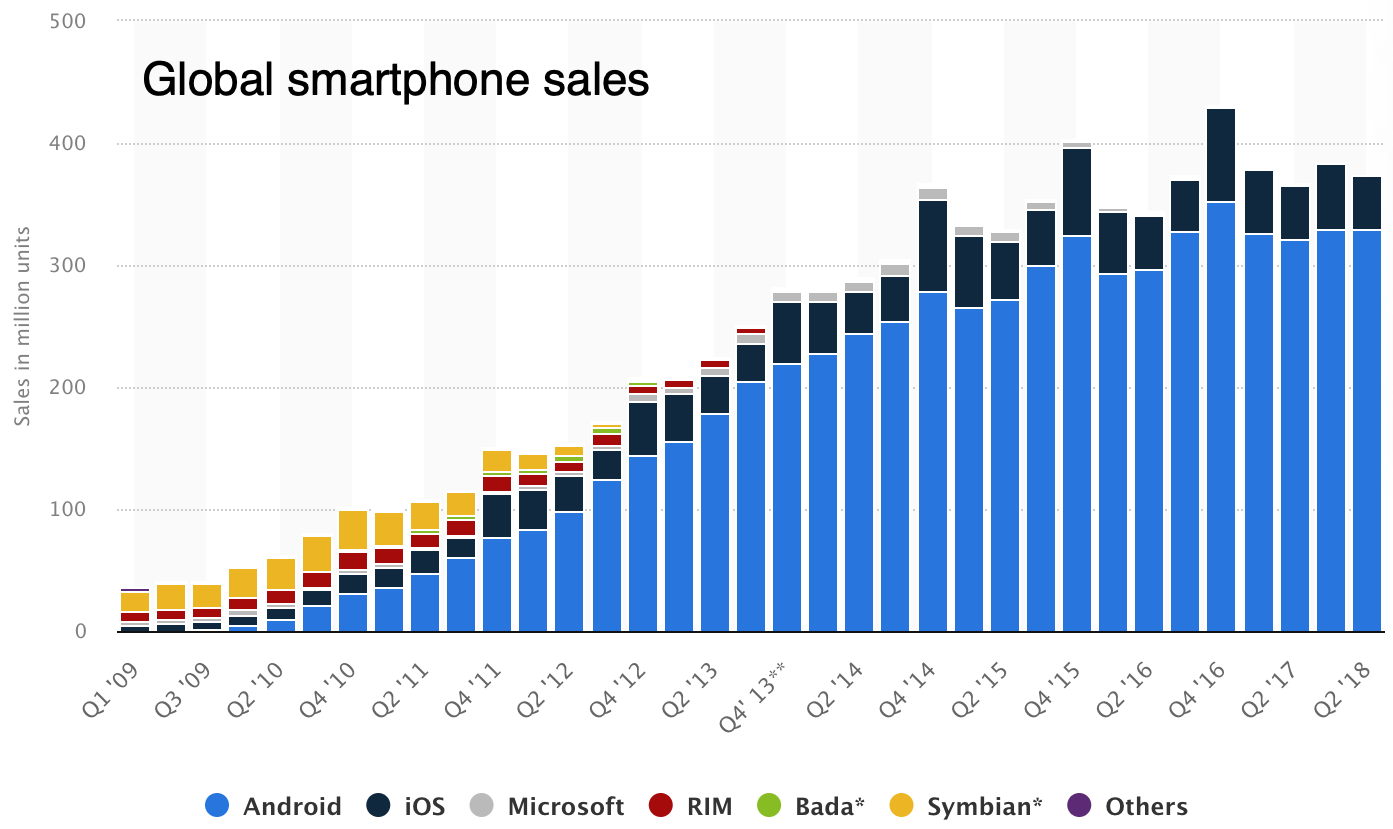
Figure 27: Smartphones are a type 3 “Hot Trend” that follows the logistic model all the way to saturation

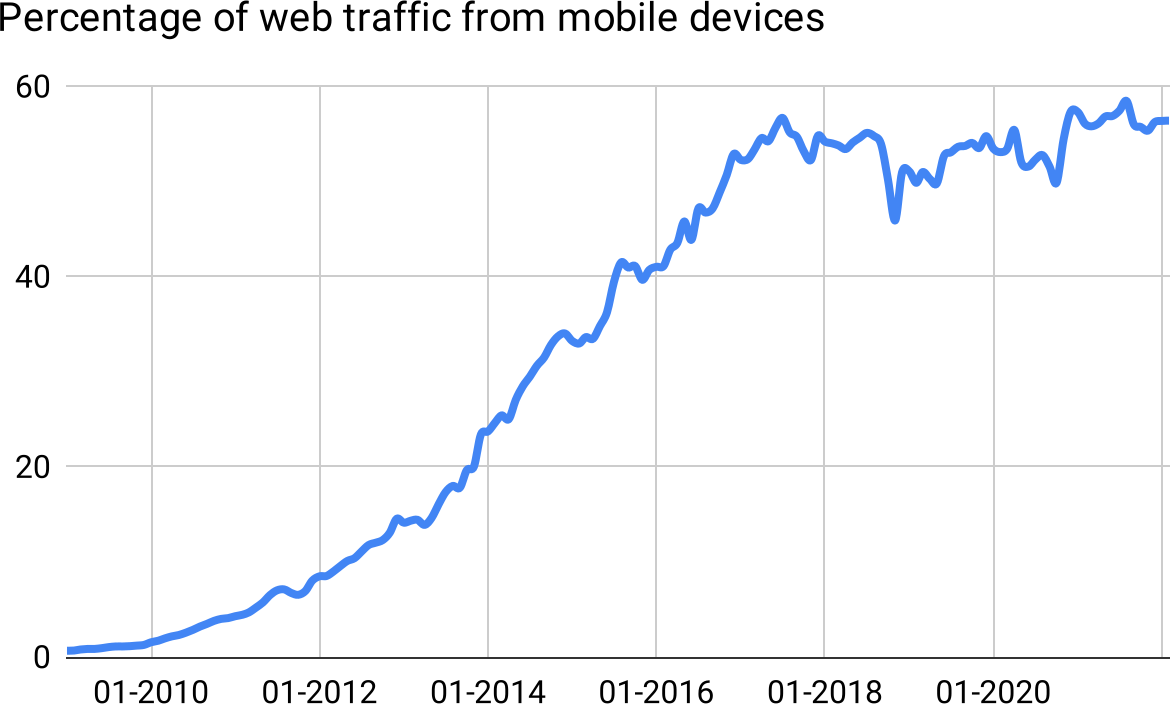
Figure 28: Smartphone usage, separate from smartphone sales, is also logistic. Many pundits predicted this percentage would grow nearly without bound; in fact it saturated at 55%.

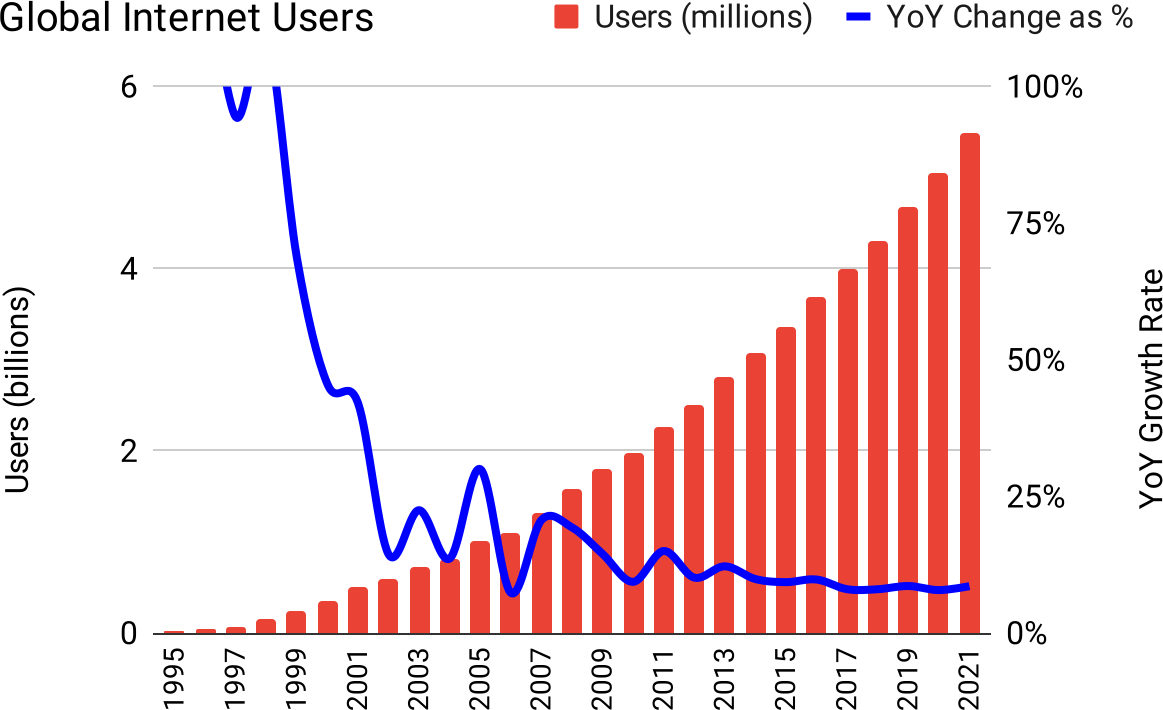
Figure 29: The internet is a type 3 “Hot Trend” product with a near-exact logistic shape; at 66% global penetration, it hasn’t reached carrying-capacity, but it’s been in its linear mode for many years, and fell off the exponential path sooner than you might have expected
Stacking logistic growth: The quadratic reappears
Marketing-driven products demonstrated quadratic growth, especially once Elephant-shaped campaigns and products were stacked. How does this differ with logistic growth?
As already pointed out, logistic growth is similar to the Elephant Curve. The “high growth” portion of a marketing campaign might in fact be logistic; a product might extend that period into years rather than weeks, and the absolute magnitude of the result might be many times larger.
If this idea is correct, we ought to see viral-like products exhibit a similar curve to the iPod curve—i.e. a product with initially-exponential growth, then a flattening, perhaps with some small growth, then on a long-enough timeline, a decline. An Elephant with a more stretched-out trunk.
The Facebook Messenger product appears to exhibit at least the first half of the logistic curve:

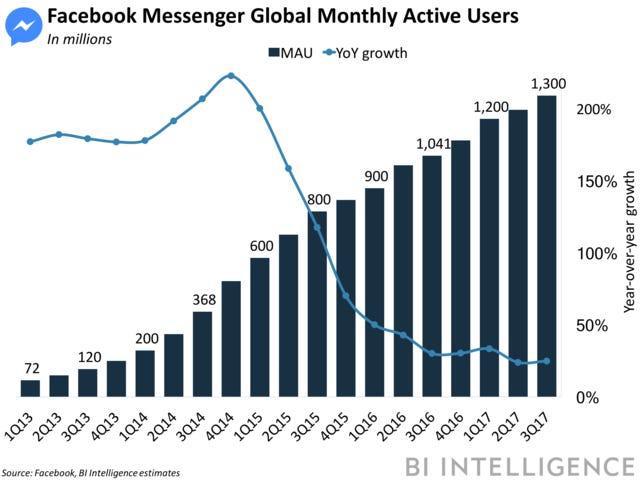
Figure 30
Furthermore, this curve is actually a sum of US growth and outside-US growth. Looking only inside the US, Facebook Messenger is further along the curve, past the linear midsection and already leveling out near some carrying-capacity:

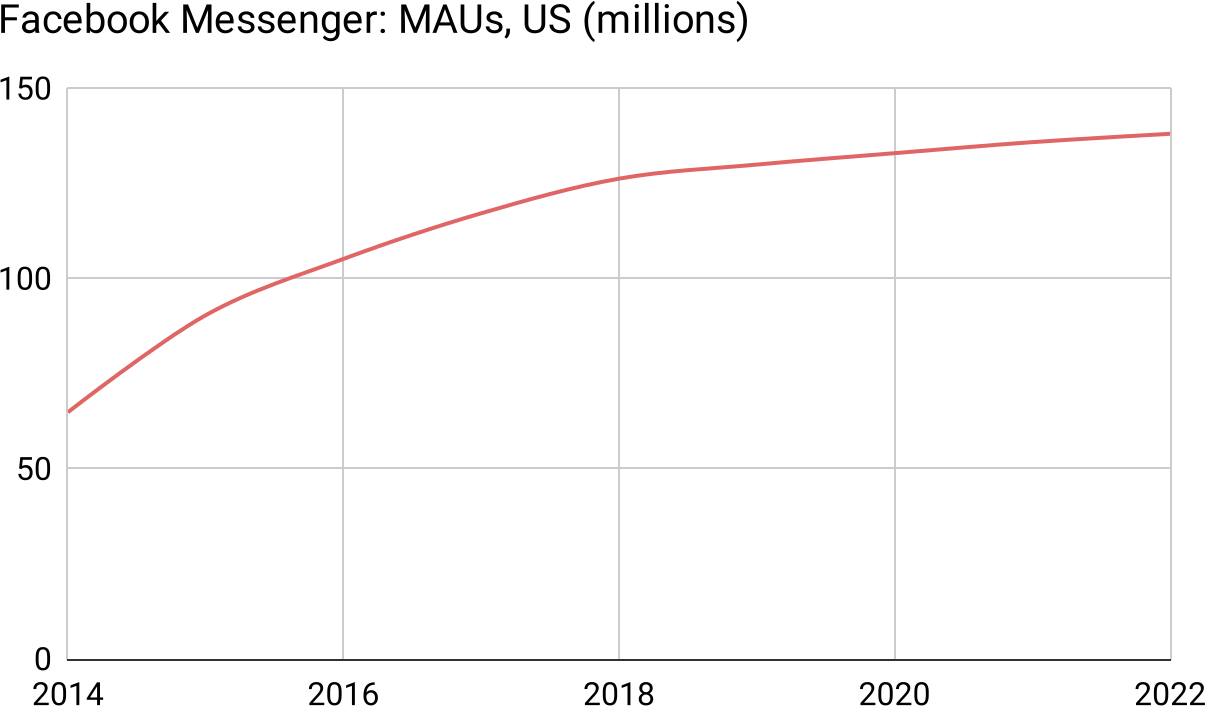
Figure 31
The same thing happens with Facebook DAUs and MAUs.10 DAUs in the United States and Canada are logistical and have already topped-out at an apparent natural carrying-capacity of 185 million:
10 Daily Active Users, Monthly Active Users

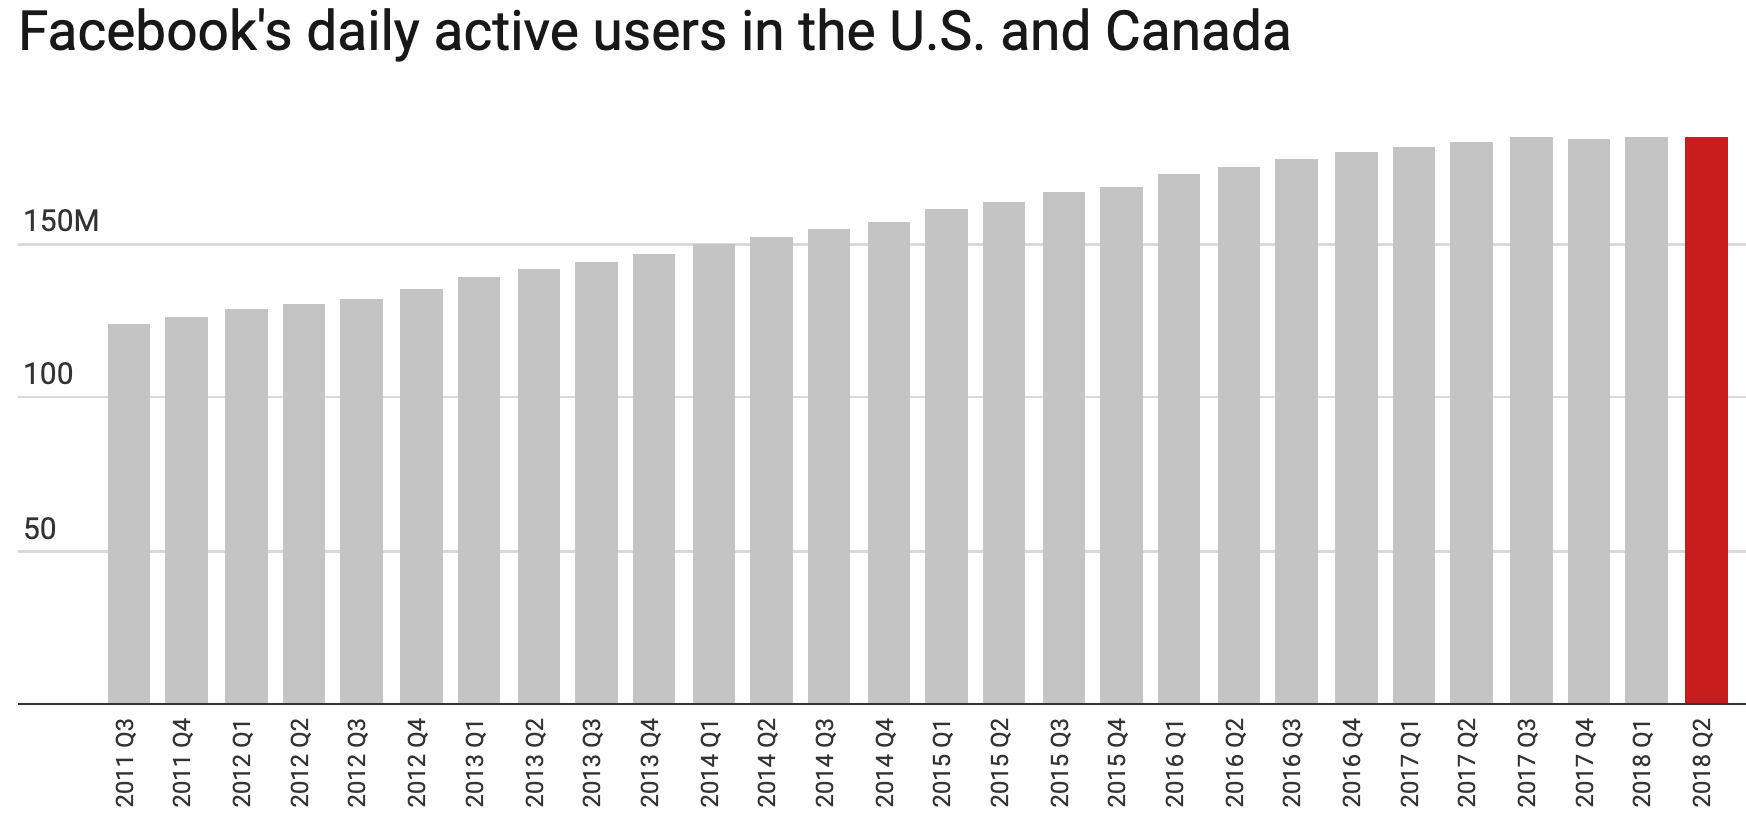
Figure 32
Breaking out MAUs by all geographies reveals that top-line growth of users is an aggregate of some geographies essentially not growing at all (late in the curve), while others are still growing, albeit also linearly (middle of the curve):

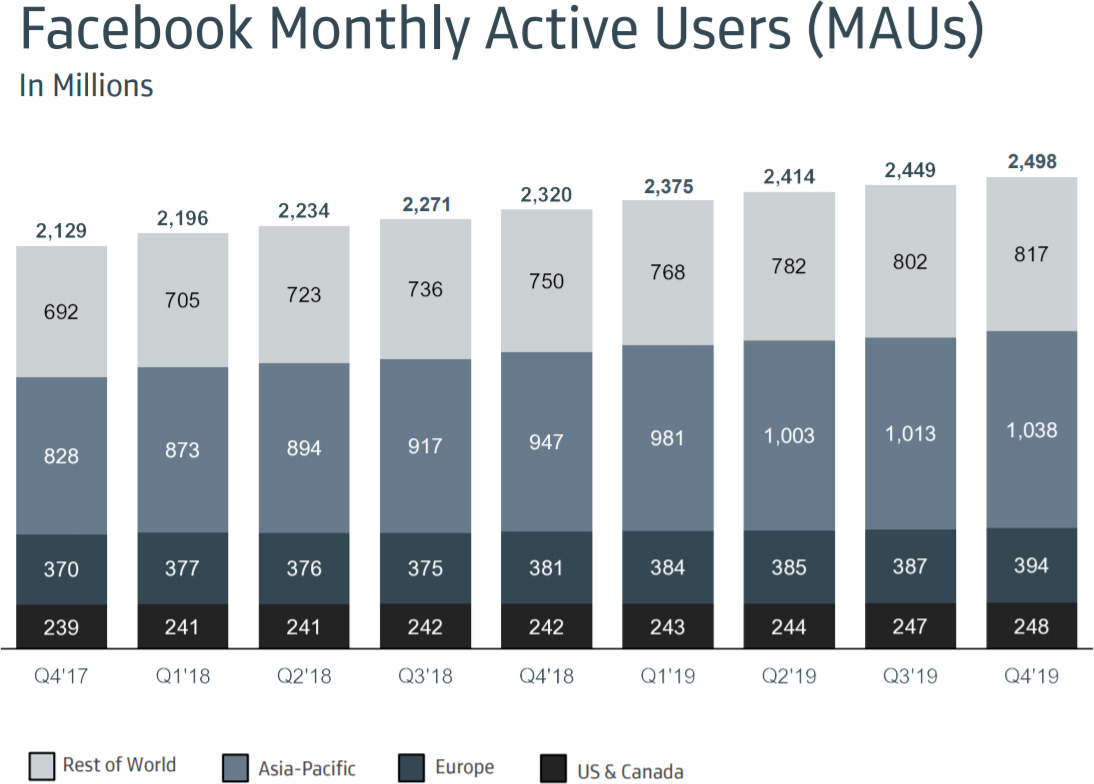
Figure 33
The result of these individual effects of different products, released at different times, in different geographies, each with a “marketing campaign” style growth curve, is that it adds up to linear growth:

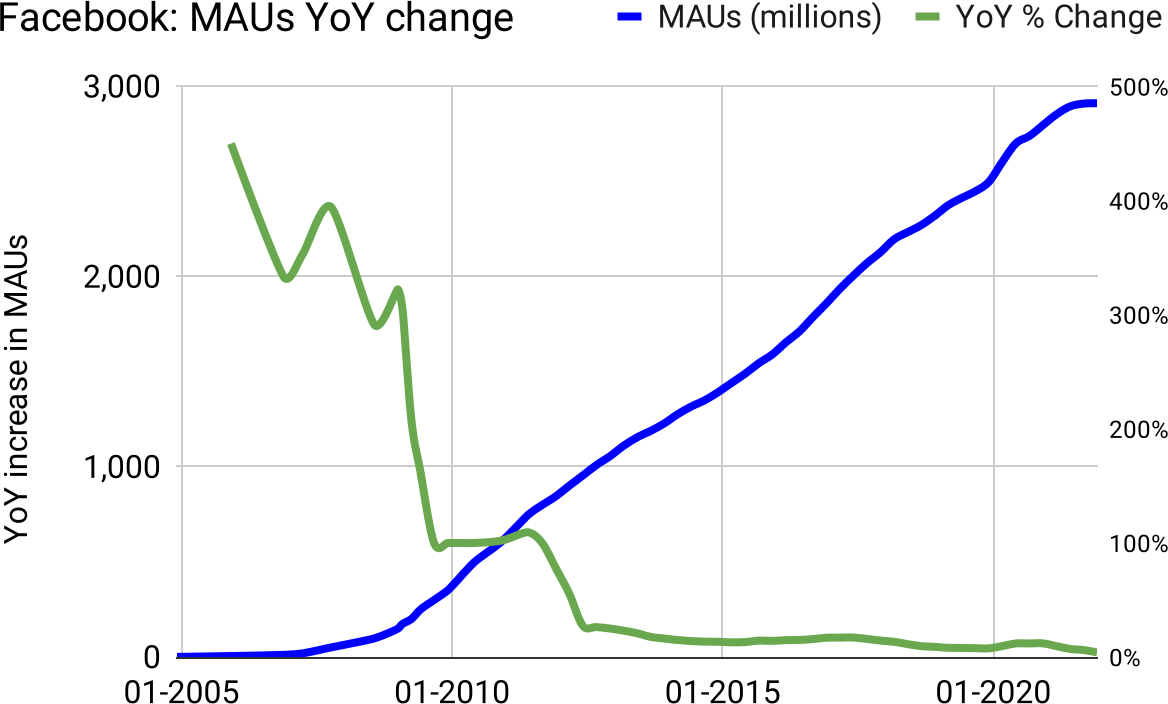
Figure 34: Exponential growth for the first few years crashes down into linear growth for nearly twenty years, from large-scale logistic-shaped products and geographies
Does this conform to the Elephant Curve? Is this really still essentially quadratic? The answer is clear when we plot the same data, this time measuring the year-over-year change in MAUs. Not as a percentage, but as numbers:

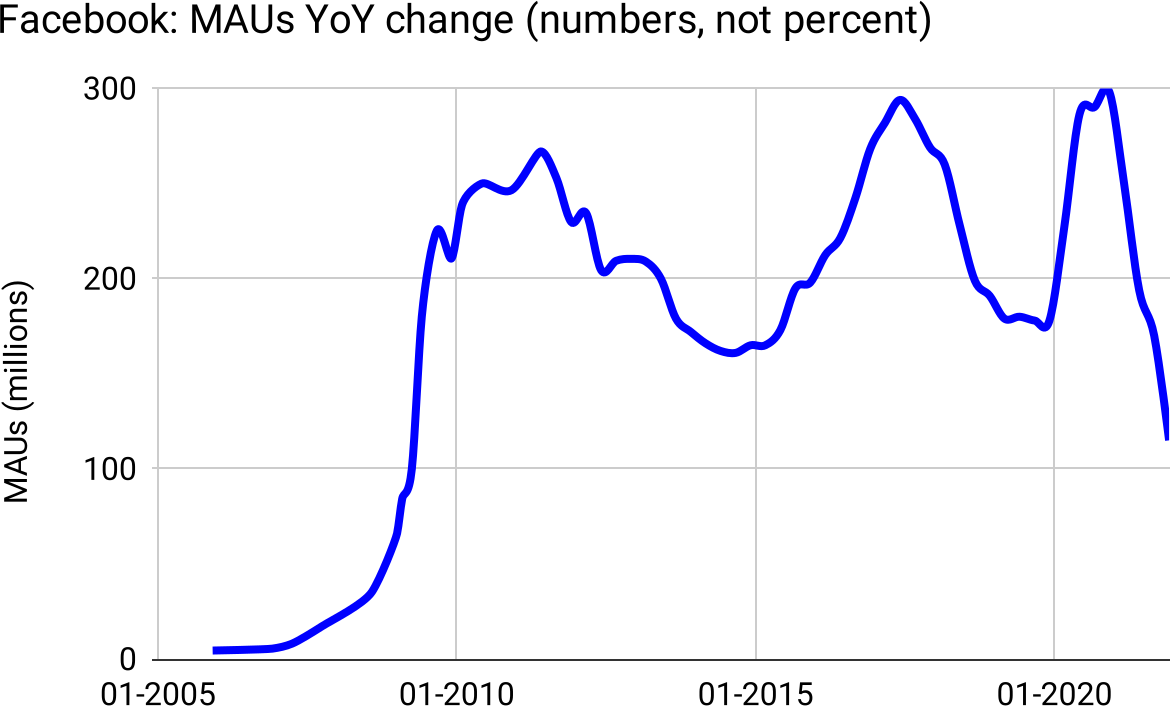
Figure 35: Facebook MAU growth is indeed an Elephant Curve: Logistic at first, then flat(ish), then starting to decline.
Why do we keep seeing this pattern, even at the scale of Facebook, one of the most “viral” products of all time? Because mathematically, things that look like an Elephant Curve, even if the logistic “trunk” is elongated over time, are linear for nearly their entire lifetimes. Everywhere except the very beginning. Adding up linear things definitionally creates a quadratic.
As a striking example of this claim—that multiple, various Elephant Curves result in quadratic growth in the real world—consider the detail behind the earlier chart of Global Internet Users over time, a type 3 product. Every country has grown logistically, at a variety of starting-times, diffusion rates, and carrying capacities, yet the aggregate is quadratic:
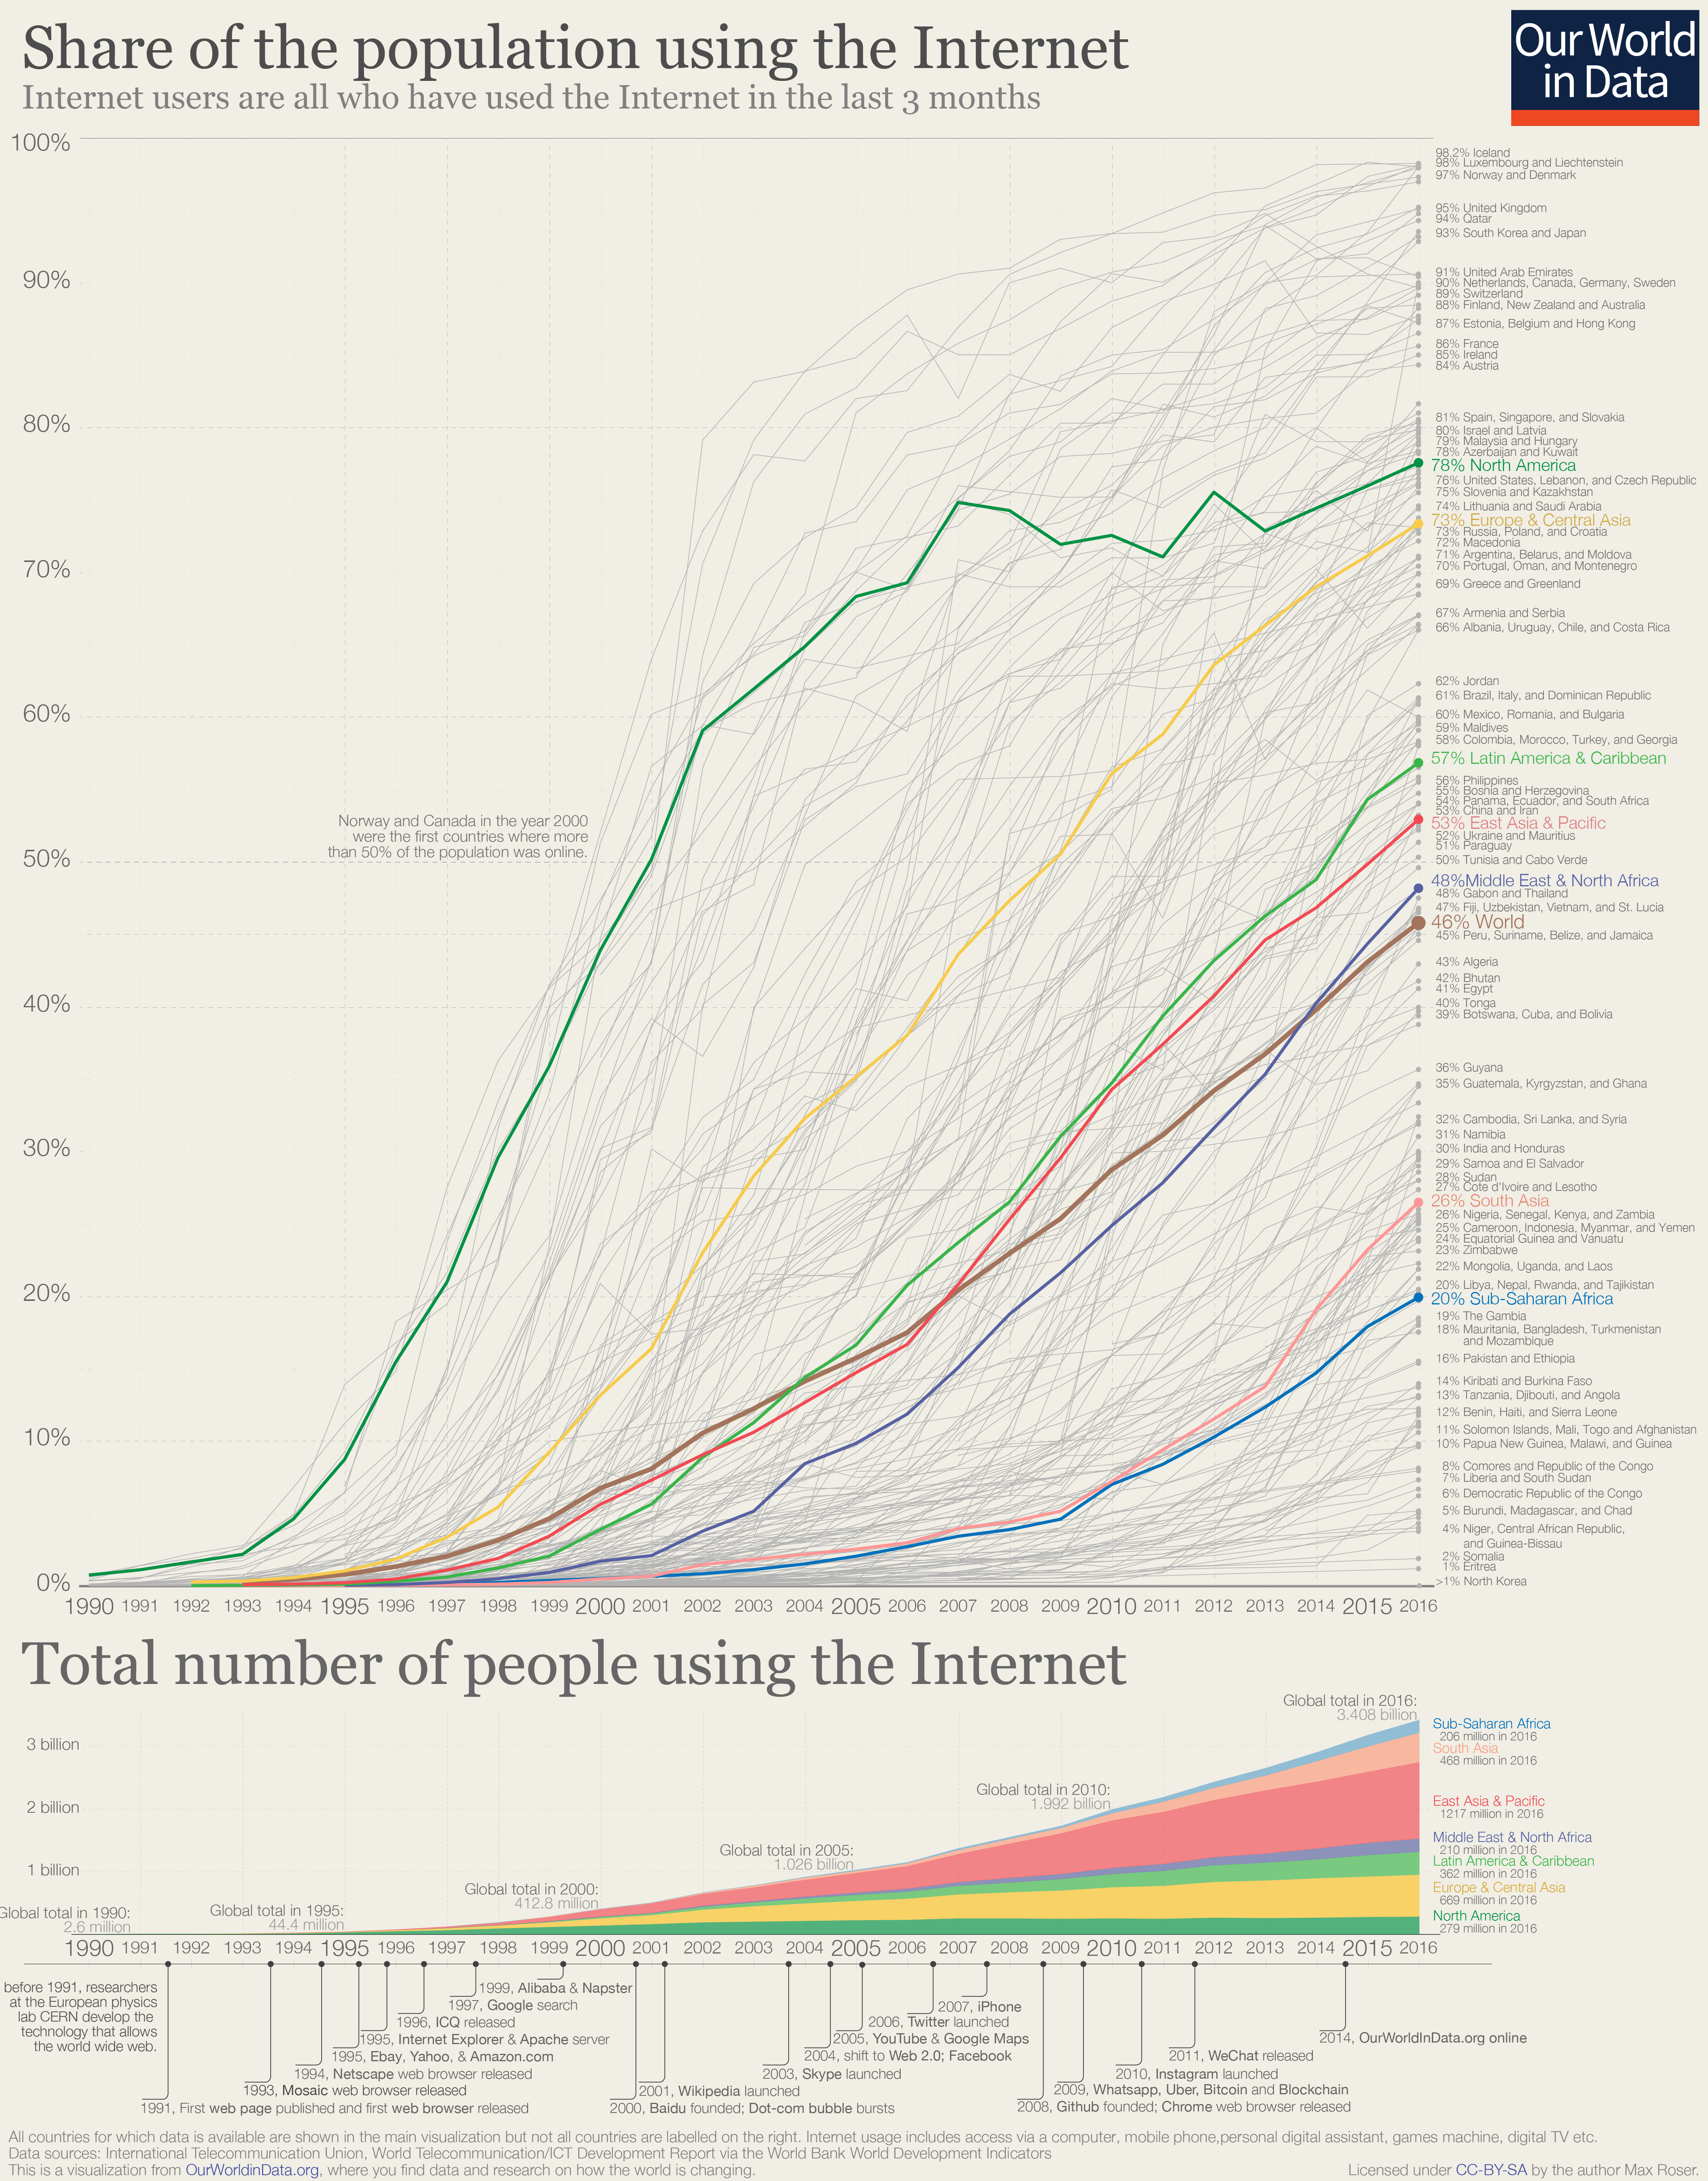
Figure 36: Thirty years of varied logistic growth adds up to quadratic growth
To be certain the graph at the bottom (which is the same data as the chart shown earlier) is specifically quadratic, we chart the absolute difference in online population year by year. In a quadratic, these differences should grow linearly, i.e. each year adding a constant amount more than the previous year added. Which is indeed what we find, as precisely as we could expect from data in the messy real-world:

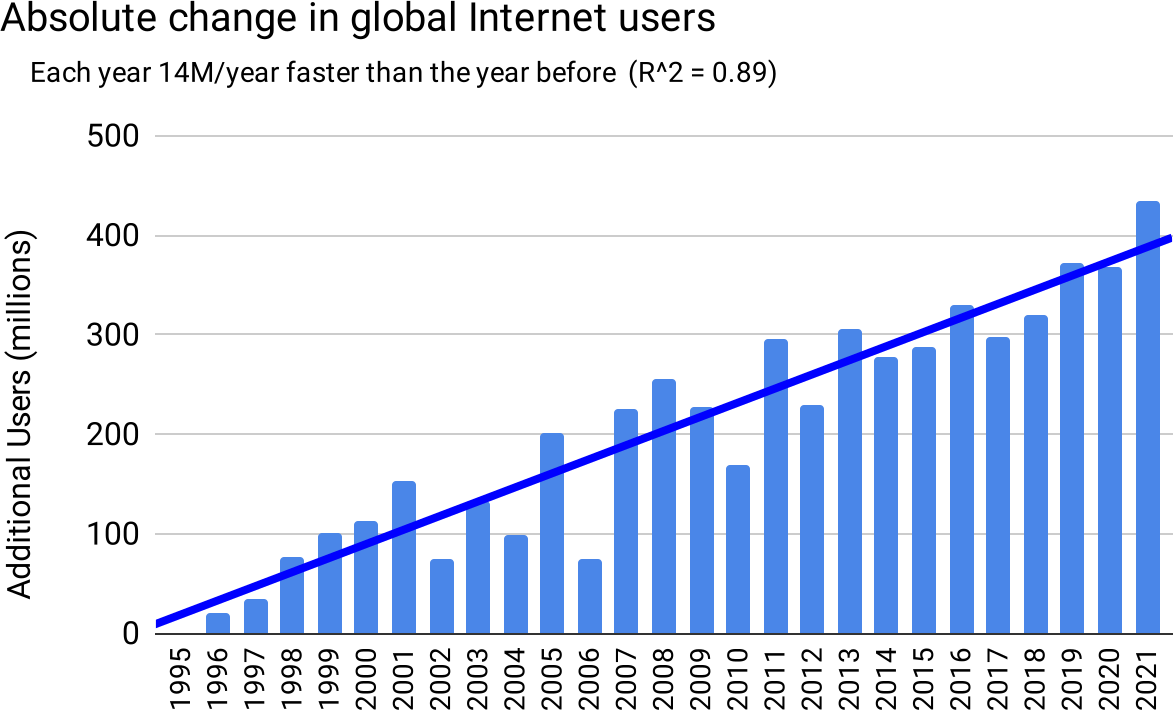
Figure 37
Bringing it back down to the scale of a single company, consider Netflix, another type 3 product. While their overall growth accelerates, under the hood we can see the US was already in a phase of slow-growth by 2014, with outside-US is taking up the slack through 2019:

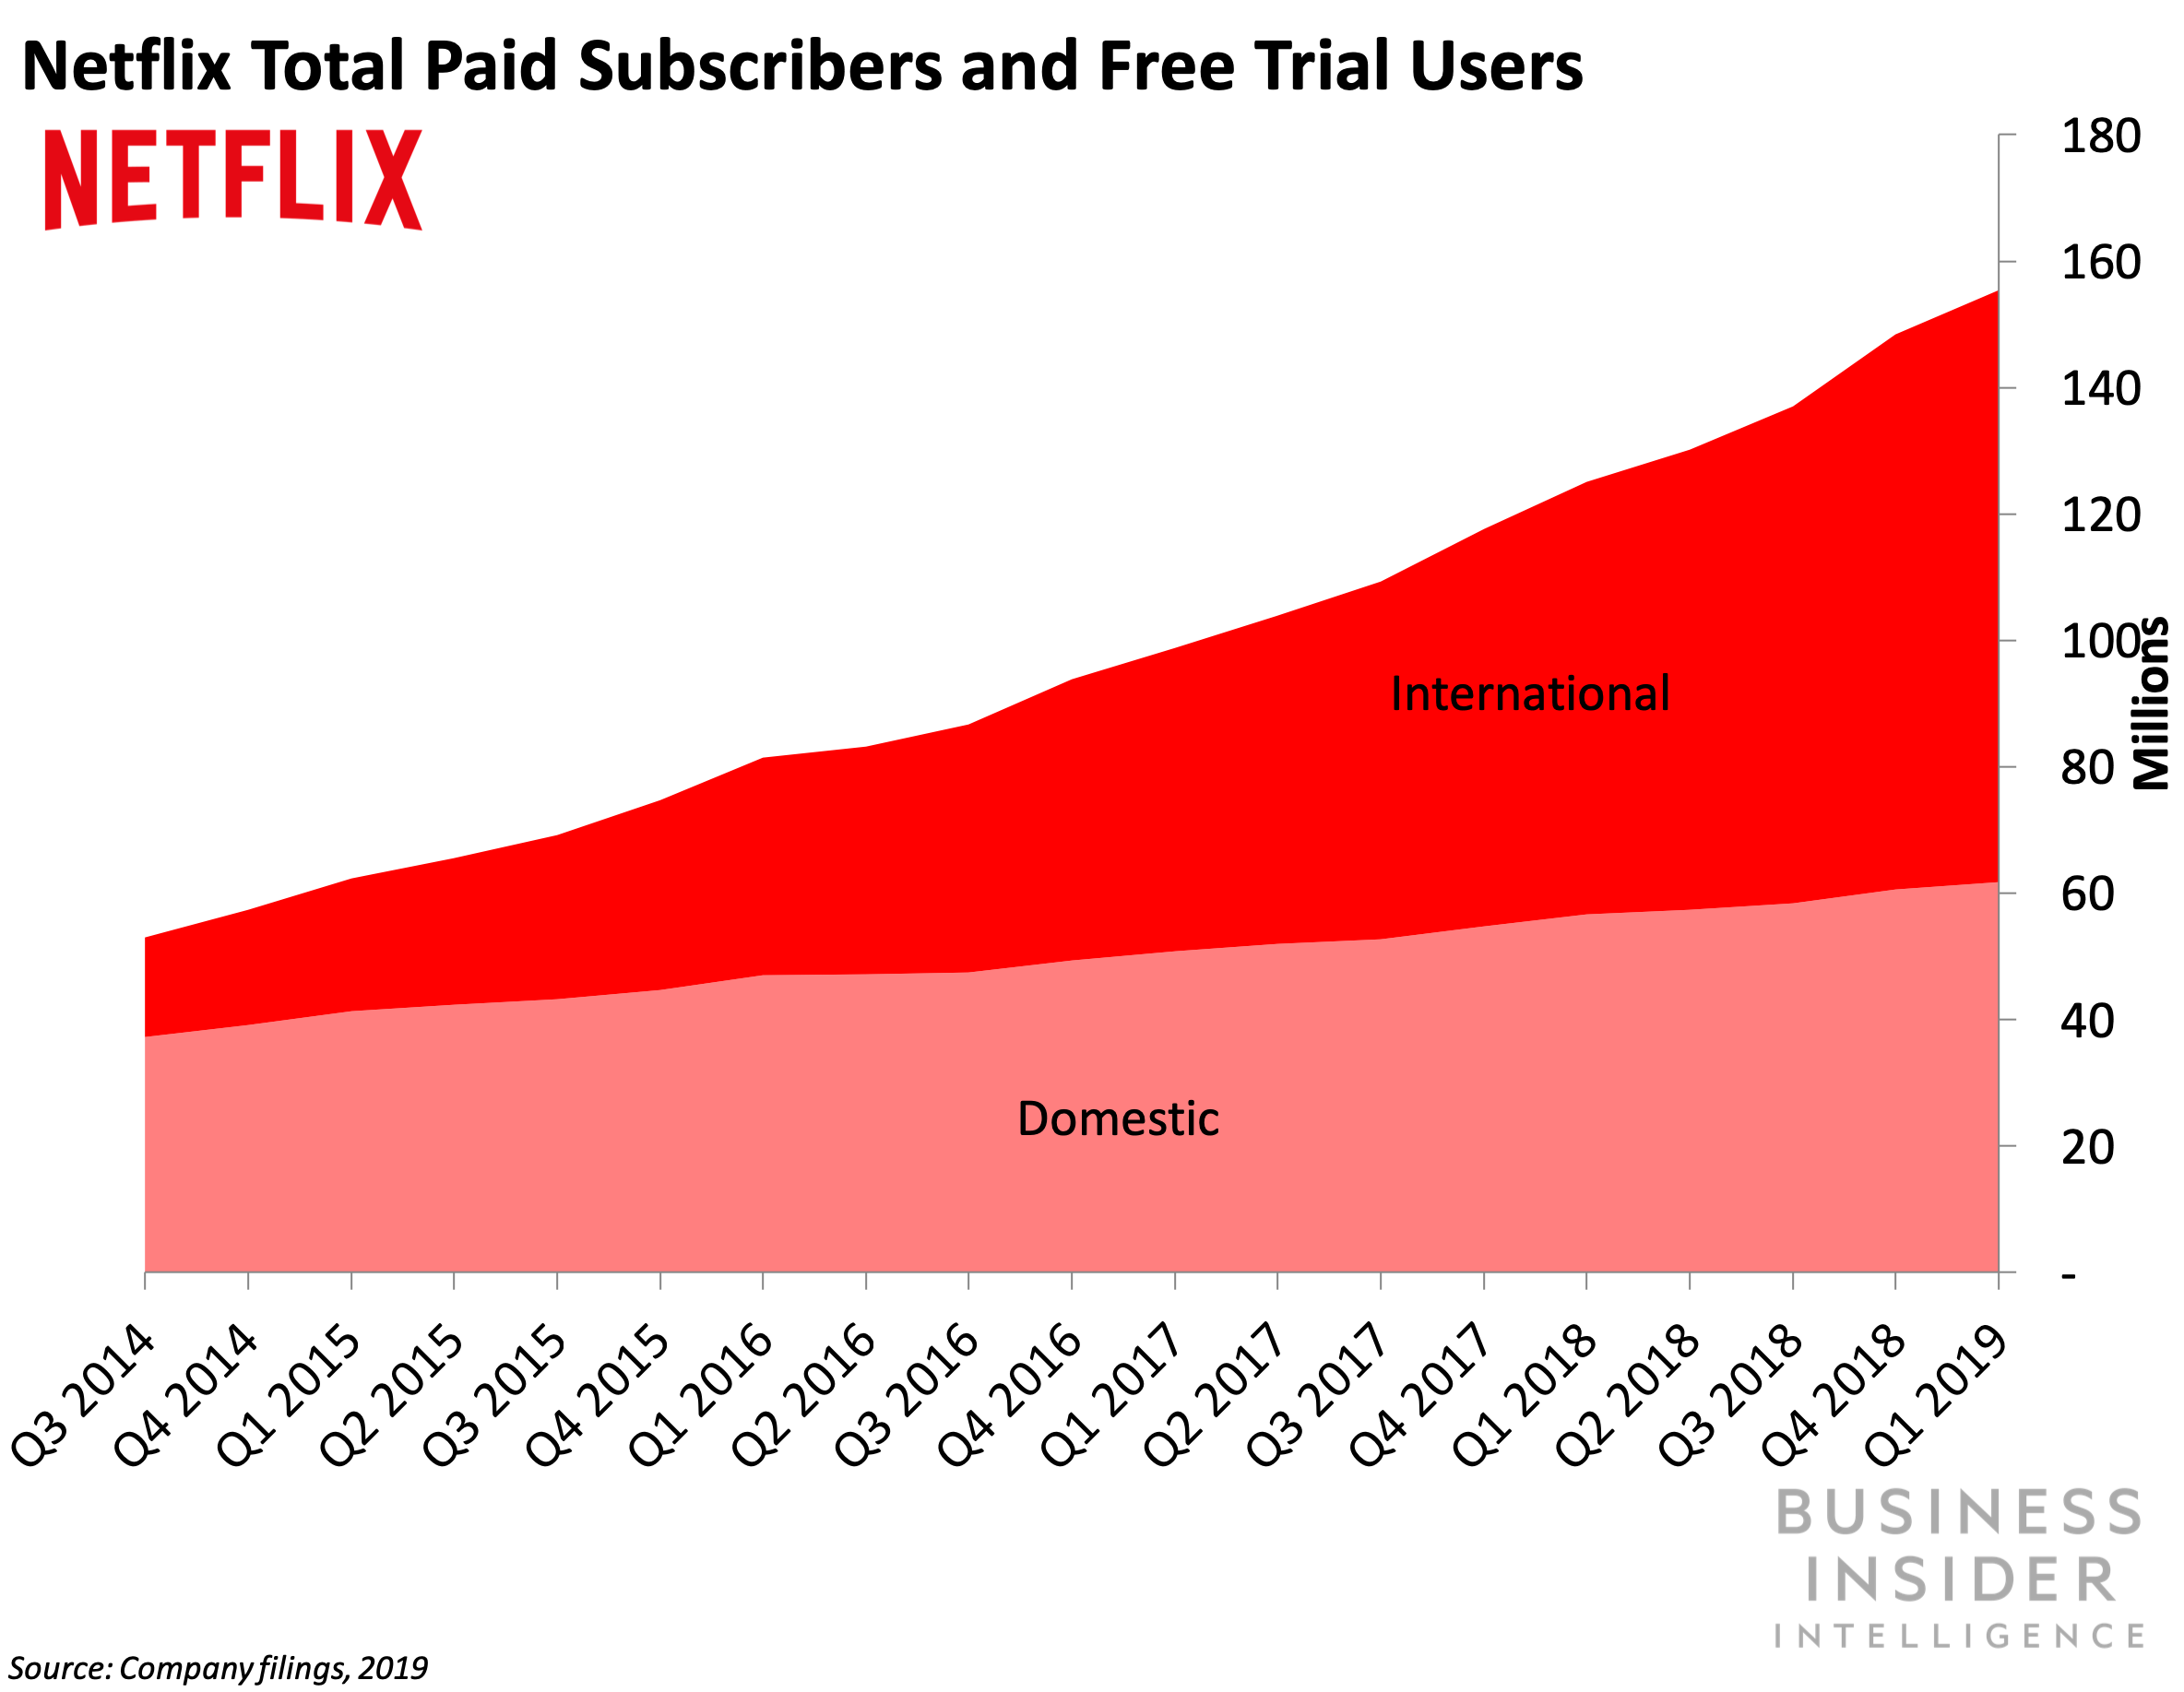
Figure 38: A quadratic top-line, created by two roughly-linear geographies
If we chart the changes in subscribers, rather than totals, it’s even more clear that growth in the US has been in the declining phase of the Elephant Curve for a while, with outside-US is growing linearly:

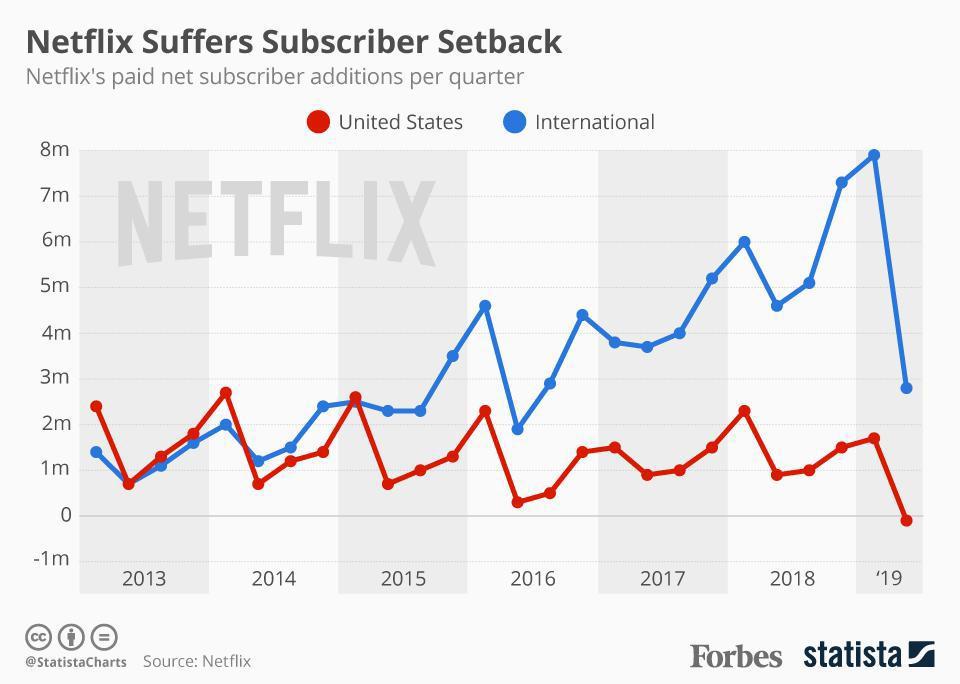
Figure 39
And then, fast-forwarding to 2023, looking at total, global subscribers, we see that growth slowed outside of the US as well, and the familiar Elephant Curve returns in its entirety:

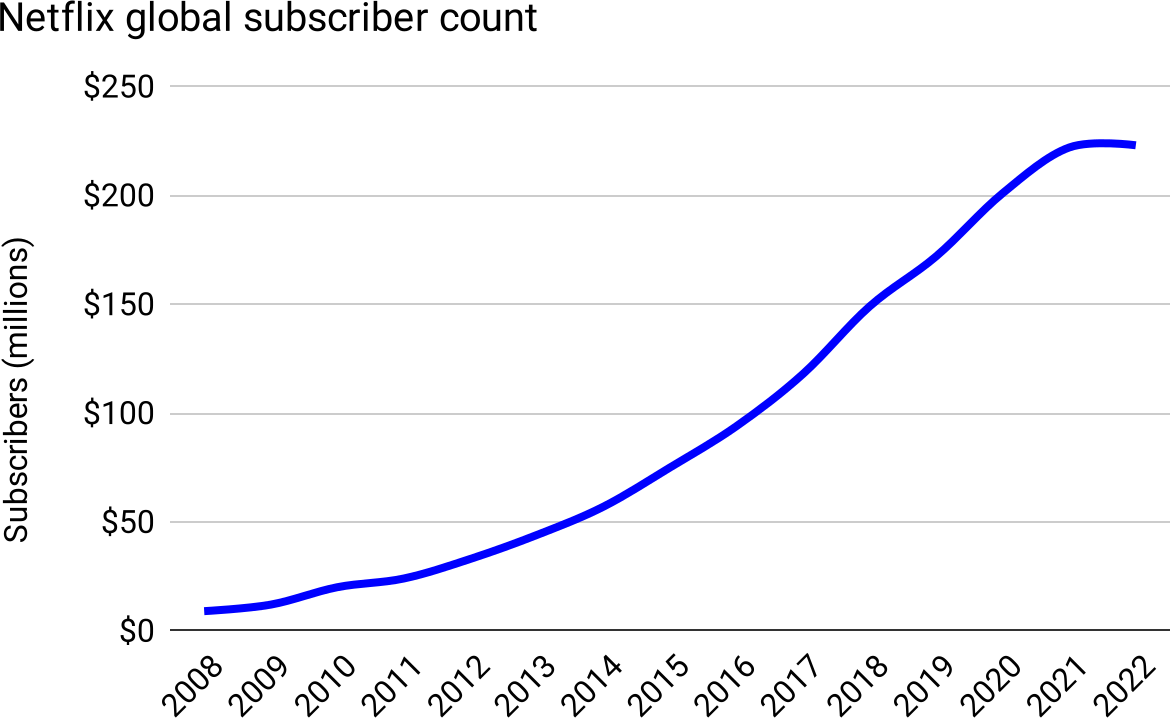
Figure 40
Logistic growth with a varying carrying capacity: Start with market-share
Suppose you’re Facebook, and you’ve saturated many markets. You might be at carrying-capacity for those markets, but more people are still coming online. The markets are growing, so your carrying-capacity is growing, so you should still be able to grow too.
Indeed, recalling the charts above, Facebook’s current MAU growth rate, and that of global internet users, both are currently hovering around 7% per year. Which isn’t a coincidence.
Let’s plot Facebook’s MAUs as a percentage of people online—their market share:

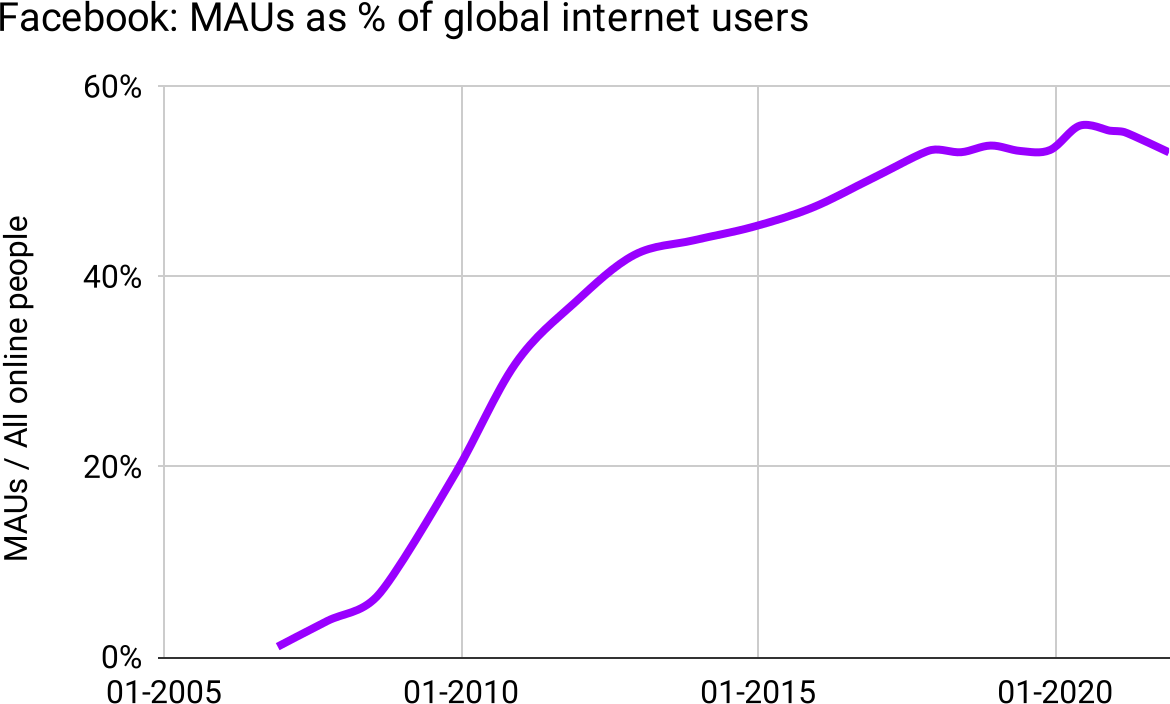
Figure 41: The Elephant Curve strikes again
Finally we have the complete answer to why Facebook’s growth appears so “linear,” when the theory expects an Elephant Curve. When you examine growth relative to market size it is an Elephant, complete with logistic trunk, optimized back, and declining rump (even despite a COVID bump).
This is why at-scale companies are willing to spend billions of dollars increasing the size of the market—it’s one of the few ways to create growth other than raising prices. So Google spent billions on Loon—a subsidized service to bring low-cost internet to remote areas of the world. Its problem-statement is the first text on its website: “Billions of people across the globe still don’t have reliable, affordable access to the internet.” Or, putting it another way, “Wifi balloons are a kooky idea but how else are we going to increase the carrying-capacity of the ‘global internet user’ Elephant Curve?”
Or Facebook with its “Free Basics” system that ( in their words) “Helps people discover the relevance and benefits of connectivity with free access to basic online services.” Except actually it’s only a few, hand-curated websites, all of which just happen to be western consumer products companies that are large Facebook advertisers, and the only available social network just happens to be Facebook. And there’s no email, so I hope you like Facebook Messenger. In other words, a digital colonialism whose purpose is to increase the carrying capacity of Facebook MAUs and the advertising that goes with it.
Elephant Curves are more visible when we plot growth as market share, because this incorporates the idea that carrying-capacity of the underlying market can itself be a moving target.
Logistic growth with a varying unit revenue
We’ve largely been analyzing users rather than revenue, and for good reason: The lifeblood of any product is people who use it, regardless how much money it can extract in the process.
However, when we turn to revenue, we find that curves can become perkier. Facebook’s user growth might be linear, but could it be that revenue is exponential? It’s certainly not linear:

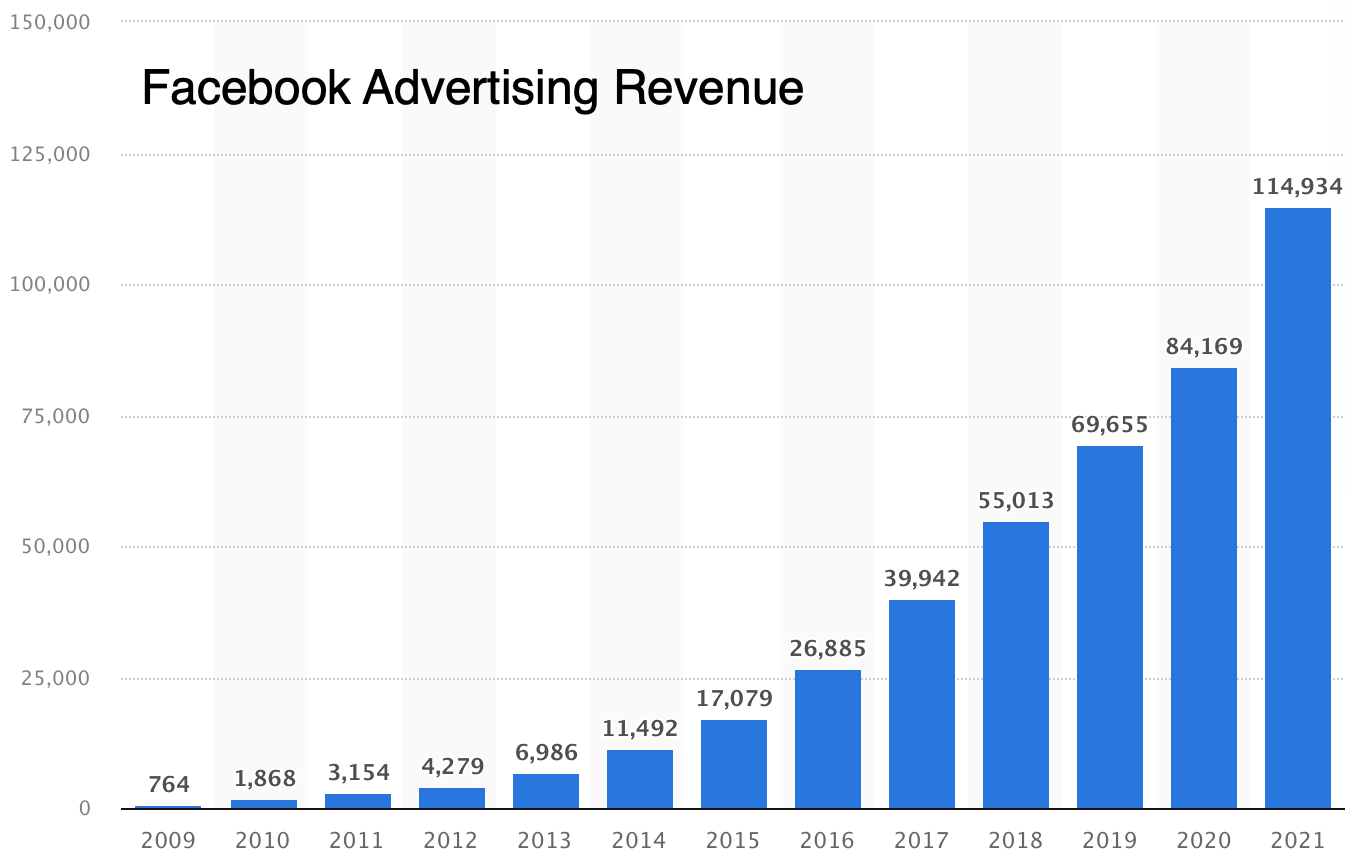
Figure 42
We already know Facebook’s user growth is linear, so the missing piece is Facebook’s revenue per user:

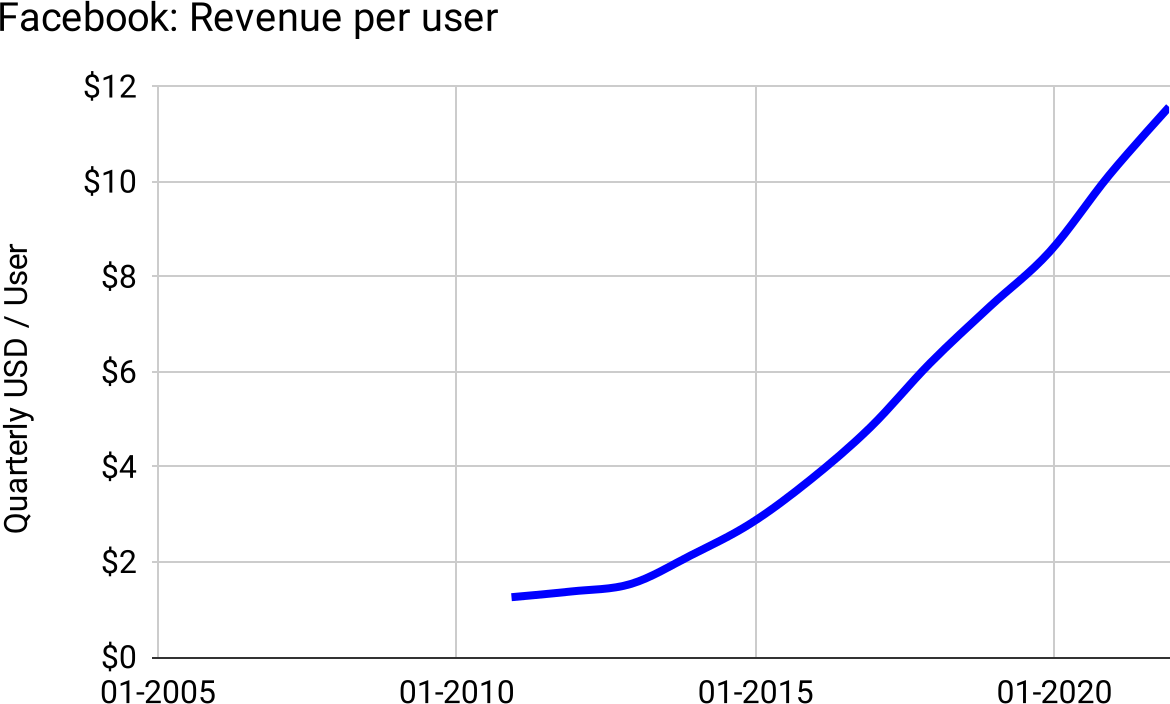
Figure 43: Logistic or Elephant yet again
Perhaps by now we’re not shocked to see the Elephant Curve once again. And we also know how the rest of the story goes: Because MAUs are Elephantine (which means mostly linear), and revenue-per-user is Elephantine (which means mostly linear), when you multiply them you get a quadratic, not an exponential, and that’s what we see in Facebook’s overall revenue growth.
Actionable conclusions
When we seek out the Elephant Curve in our marketing channels, product lines, geographies, and verticals, not just in its hopefully-explosive initial phase, but its phases of optimization and decline, we can proactively look for these phases, and take action.
Model by component
Our final discussion on the value of analyzing components of growth separate leads to a prescription for analyzing growth.
- Estimate the growth curve for the entire market. Expect to be Elephantine (or simply logistic, in the case of trends that you can reasonably assume will not decline in the forecasted future, like global internet use or smartphone use).
- Estimate the product market-share curve. Expect to be Elephantine, and don’t be so bold as to assume your product will never decline relative to the market—are you better at execution than Facebook?
- Estimate monetization, i.e. revenue per customer.11 This curve might be Elephantine, but not necessarily. It is highly dependent on the product and market, on how distinct the product is competitively, on the budgets of the customers, and more. Facebook has a strong moat (network effect) and doesn’t charge end-users, so they (like Google) can raise prices consistently. A product in a commoditized market might never be able to raise prices, and thus must find growth in avenues like increasing usage, the introduction of companion products, expanding to other verticals or geographies, or by applying their technology to new markets.
11 The definition of “customer” should match whatever activity is most highly correlated with growth; this is also what “market share” should mean. For normal products people pay for, this is simply “paying customers,” but for example in the case of Facebook, this is MAUs at least, perhaps even DAUs.
You get better models by predicting each of these components separately, then multiplying for a final growth prediction. You’re also better able to track the model against reality, as more data becomes available.
Besides this break-down, there are many operational ideas suggested by the results above, especially for managing marketing campaigns.
This might be expanded in a future article, but for now, these probing questions might lead to better ideas on how to analyze and affect growth:
Advice for Marketing teams
- Is our AdWords campaign topped out? Are we fooling ourselves into thinking there’s more inventory to access? How much more optimization is there to be had, and how would know? Are we hitting a decline due to uneconomical auctions, and if so, what is our reaction? When should we start experimenting with new channels, rather than continue to flog the AdWords channel for results that don’t exist?
- Is it OK to be less cost-effective if it means we can stave off decline? Should we be that “irrational bidder” who bids “too much” because we’re wise enough to see value beyond immediate cash pay-back? If so, how do we quantify that value, so we know just how “irrational” to be?
- To hit our growth goals for the year, what would have to be true of the growth of existing campaigns? Which can be reasonably expected to grow, hold steady, or shrink, based on their phase? How many additional, successful campaigns do we need, and how soon? Since not all that we attempt will succeed, how many do we need to start to yield the final quantity we need?
- Should we lean into newer channels before others figure them out, saturating the channel and cause clicks to be both expensive and more rare?
- Rather than stack up small, limited campaigns, is there something more substantial that could generate more total growth? A single, large new geography instead of many smaller ones? A single, substantial new sales mechanism (e.g. reselling) rather than more advertising? A different pricing model instead of an additional sales model? Even if it takes 10x the effort, and possible even if it takes 10x the time, it might have 10x the results.
- Or the reverse—do we pull funds when we smell decline, rather than spending our time and money fighting a losing battle, accepting a short-term hit on top-line growth in exchange for more efficient growth? Do we try to stack up many smaller, more efficient campaigns, generating growth as a bulk effort? Each effort affects the top line only marginally, but conversely our growth is less sensitive to the decline of any one campaign.
Advice for Product Managers
- It’s great to add a feature to an existing product, but significant additional growth comes from increasing carrying capacity or creating a new avenue of growth. Early on you should focus on winning market share in one space, creating the first Elephant Curve, but after the product matures, something more drastic is required: Wholly new products, or updates significant enough to address new markets.
- It’s well-known that companies need to add additional products to continue fast growth after achieving scale. However the second product is highly unlikely to achieve same market share and monetary scale as the first, so there needs to be multiple, not just one.12 This requires serious investment, parallel efforts, and the chutzpah to kill off the ideas that aren’t working.
- Because word-of-mouth-driven growth is so much more effective than marketing-driven growth (both in cost-per-customer and in that unlike direct advertising it grows automatically as the company grows), it is worth a great deal of time trying to figure out how to build that into the product, rather than relying only on the marketing team.
12 This is true at any scale—advertising is still 82% of Google’s revenue; of that 71% is advertising from search alone (i.e. excluding YouTube and other properties). Apple revenue is 60% iPhone. Even at smaller scales: Basecamp (neé 37signals) built multiple products over nearly two decades but only their first was successful enough to be worth working on; the company divested itself of the rest and rebranded to be identical to that product. It is possible for second products to eclipse the first; the iPhone was of course not Apple’s first product; The Tesla model 3 outsells the earlier model X, And at my own company Smart Bear our second product ended up being 95% of sales, and we essentially did the same as 37signals and went to a single product model.
Half my advertising is wasted. I just don’t know which half.
—John Wanamaker
Mr. Wanamaker made his famous complaint more than a hundred years ago; even with modern analytics, today
it’s worse. The quadratic growth model won’t solve that puzzle, but the better you understand the mechanisms of growth, the more it is under your control.


https://longform.asmartbear.com/exponential-growth/
© 2007-2026 Jason Cohen
 @asmartbear


