 ePub (Kindle)
 Printable PDF
Metrics that cannot even be measured in retrospect

Some things cannot be measured, even after months pass and we have all the facts and data and analysis at our disposal.
If they cannot be measured in retrospect, they cannot be measured now, and you certainly cannot predict them or make a goal from them.
This sounds obvious, but many of these are so tempting, seemingly so important, we end up trying anyway. But it’s a frustrating waste of time, and we ultimately fail.
Here’s some common examples so you can train your pattern-matching engine, and see how to navigate the conversations.
Impact of a single feature on the revenue of a product
There are features at WP Engine which sales team pitch because people respond with genuine excitement. But then, after the sale, customers rarely use them.1 Does that lack of usage mean the feature isn’t contributing to revenue? No, it might have helped the sale.2
1 Don’t worry, we don’t charge extra for those features, so it’s not unethical.
2 P.S. Do you think it’s wise for our competitors to copy those features? This is why you need to listen to customers instead of copying your competitors; who knows what’s going on over there.
A feature that is used frequently is almost surely valuable; it’s reasonable to claim that this feature is one of the main reasons why people pay for the product. But how much influence is it really? What if ten other features are also used frequently; do each “earn” 10% of the revenue? What if the feature is also used frequently by people who cancel—that would indicate the feature wasn’t keeping them here after all. But maybe it was, and something totally unrelated caused the cancellation. What about all those other reasons customers are willing to pay that are unrelated to that oft-used feature?
This is too difficult to unravel. This is why I like using a variety of KPIs, only one of which is “usage.” Of course product teams should celebrate when they create features that are widely used. It’s just not the same thing as revenue.
Even after the fact, with 100s of 1000s of customers (in our case at WP Engine), it’s still not possible to attribute revenue to individual features.
Impact of incremental activities on customer churn
As covered in another article, customer churn severely limits growth and, more importantly, is a lagging indicator that customers don’t want what you’re selling. Therefore, it’s almost always a good use of time to uncover the main drivers of churn, and address them with product, process, people, price, and other words that start with “p.”
So the common and very reasonable question is: If we do X, how much will churn go down? And while we’re actually doing X, how much is churn going down? And this leads to the crux: A year from now, will you then know the impact X had on churn? Unless X has an enormous and immediate impact, the answer is no.
The reasons often apply in cases besides churn, so let’s list them separately to train your pattern-matching engine, while continuing to use churn as the example:
- Cannot measure rare things, because signal is swamped by noise
- If churn is 3%/mo, an initiative that reduces churn by 10%—a big impact!—will result in 2.7%/mo. How hard is it to measure a difference of 0.3%, month over month? How much does churn vary through pure randomness? Probably more than that. Some months have 15% more weekdays than subsequent months; if most customers churns on weekdays, that could make churn vary by 15% for that reason alone—again, pure noise. You probably just can’t measure something that is so rare.
- Lag between action and reaction
- A customer who churns today has probably been unsuccessful for a while. They’ve been researching alternatives for weeks or months, weighing whether to pull the trigger. Larger customers might have tried to make it work for a year or more, then ran a multi-month process to investigate the options. So, an activity you start today is unlikely to change the trajectory of customers who have already decided to leave, and only today happened to push the red button.
- Many causes of a result, means it’s hard to measure a change in any one cause
- There are many reasons why people leave. Some were never that interested, and didn’t get hooked. Some got mad because of support interactions, even though they like the product. Some finally gave up waiting for you to make a feature they’ve needed, even though they love the support interactions. Some were never the right fit, but tried to make it work, and so did you. Some forgot they even had it unless their spouse asked what this credit card charge is. So any one action you take is likely incremental, difficult to measure in the fog of almost every customer not caring about that particular thing.
- External forces that are larger than forces under your control
- The market, competition, and the economy at large has a large yet unmeasurable impact. You can just go blaming the global economy—you have a business to run, and you are in control of more than you’re currently controlling. Still, it’s easy to map things like growth rates and churn rates onto the US stock market or inflation. Sometimes it can be the largest factor. How, in the face of these major factors, will you measure the tiny blips that your incremental work might accomplish?
Does this mean we shouldn’t work on improving churn? Of course not—again it’s one of the most valuable things any company can do, because retention compounds, and all the profit generated by a customer of a SaaS business happens in the later years, after they’ve paid back the sales and marketing expenses, gotten past the higher-than-average initial support load, and after your gross margins expand with scale.
But, trying to measure the impact of a single activity is folly;3 even a year later, you’ll never know how much that factored in relative to all the other things.
3 The exception is when your churn is especially bad; anything over 3%/mo is scary. Then, sometimes it’s possible to make large improvements.
Probabilities of “risks”
The “Risk Slide” lists things that could derail the project or even tank the company. Executives quite rightly want to know: What is the chance that this will happen, and what is the magnitude of the impact if it does?
We can’t invest in mitigating low-probability risks, although we might monitor the situation if the impact would be high. Conversely, high-probability risks might need proactive mitigation efforts. Thus the “probability of the event” is critical information, because it determines our actions.
But these probabilities aren’t possible to measure, even after the fact.
Each risk is independent. It will happen, or it won’t. You won’t find out for months, maybe years. Then one or two happen and six don’t. Maybe the one that happened was listed as a 30% probability,4 and one that didn’t was listed at 70%. Does that mean the probabilities were wrong? No, because 30% doesn’t mean 0% and 70% doesn’t mean 100%.
4 If you’re lucky; I often see probabilities listed as “medium” or “low.” Here’s how to talk about probabilities properly.
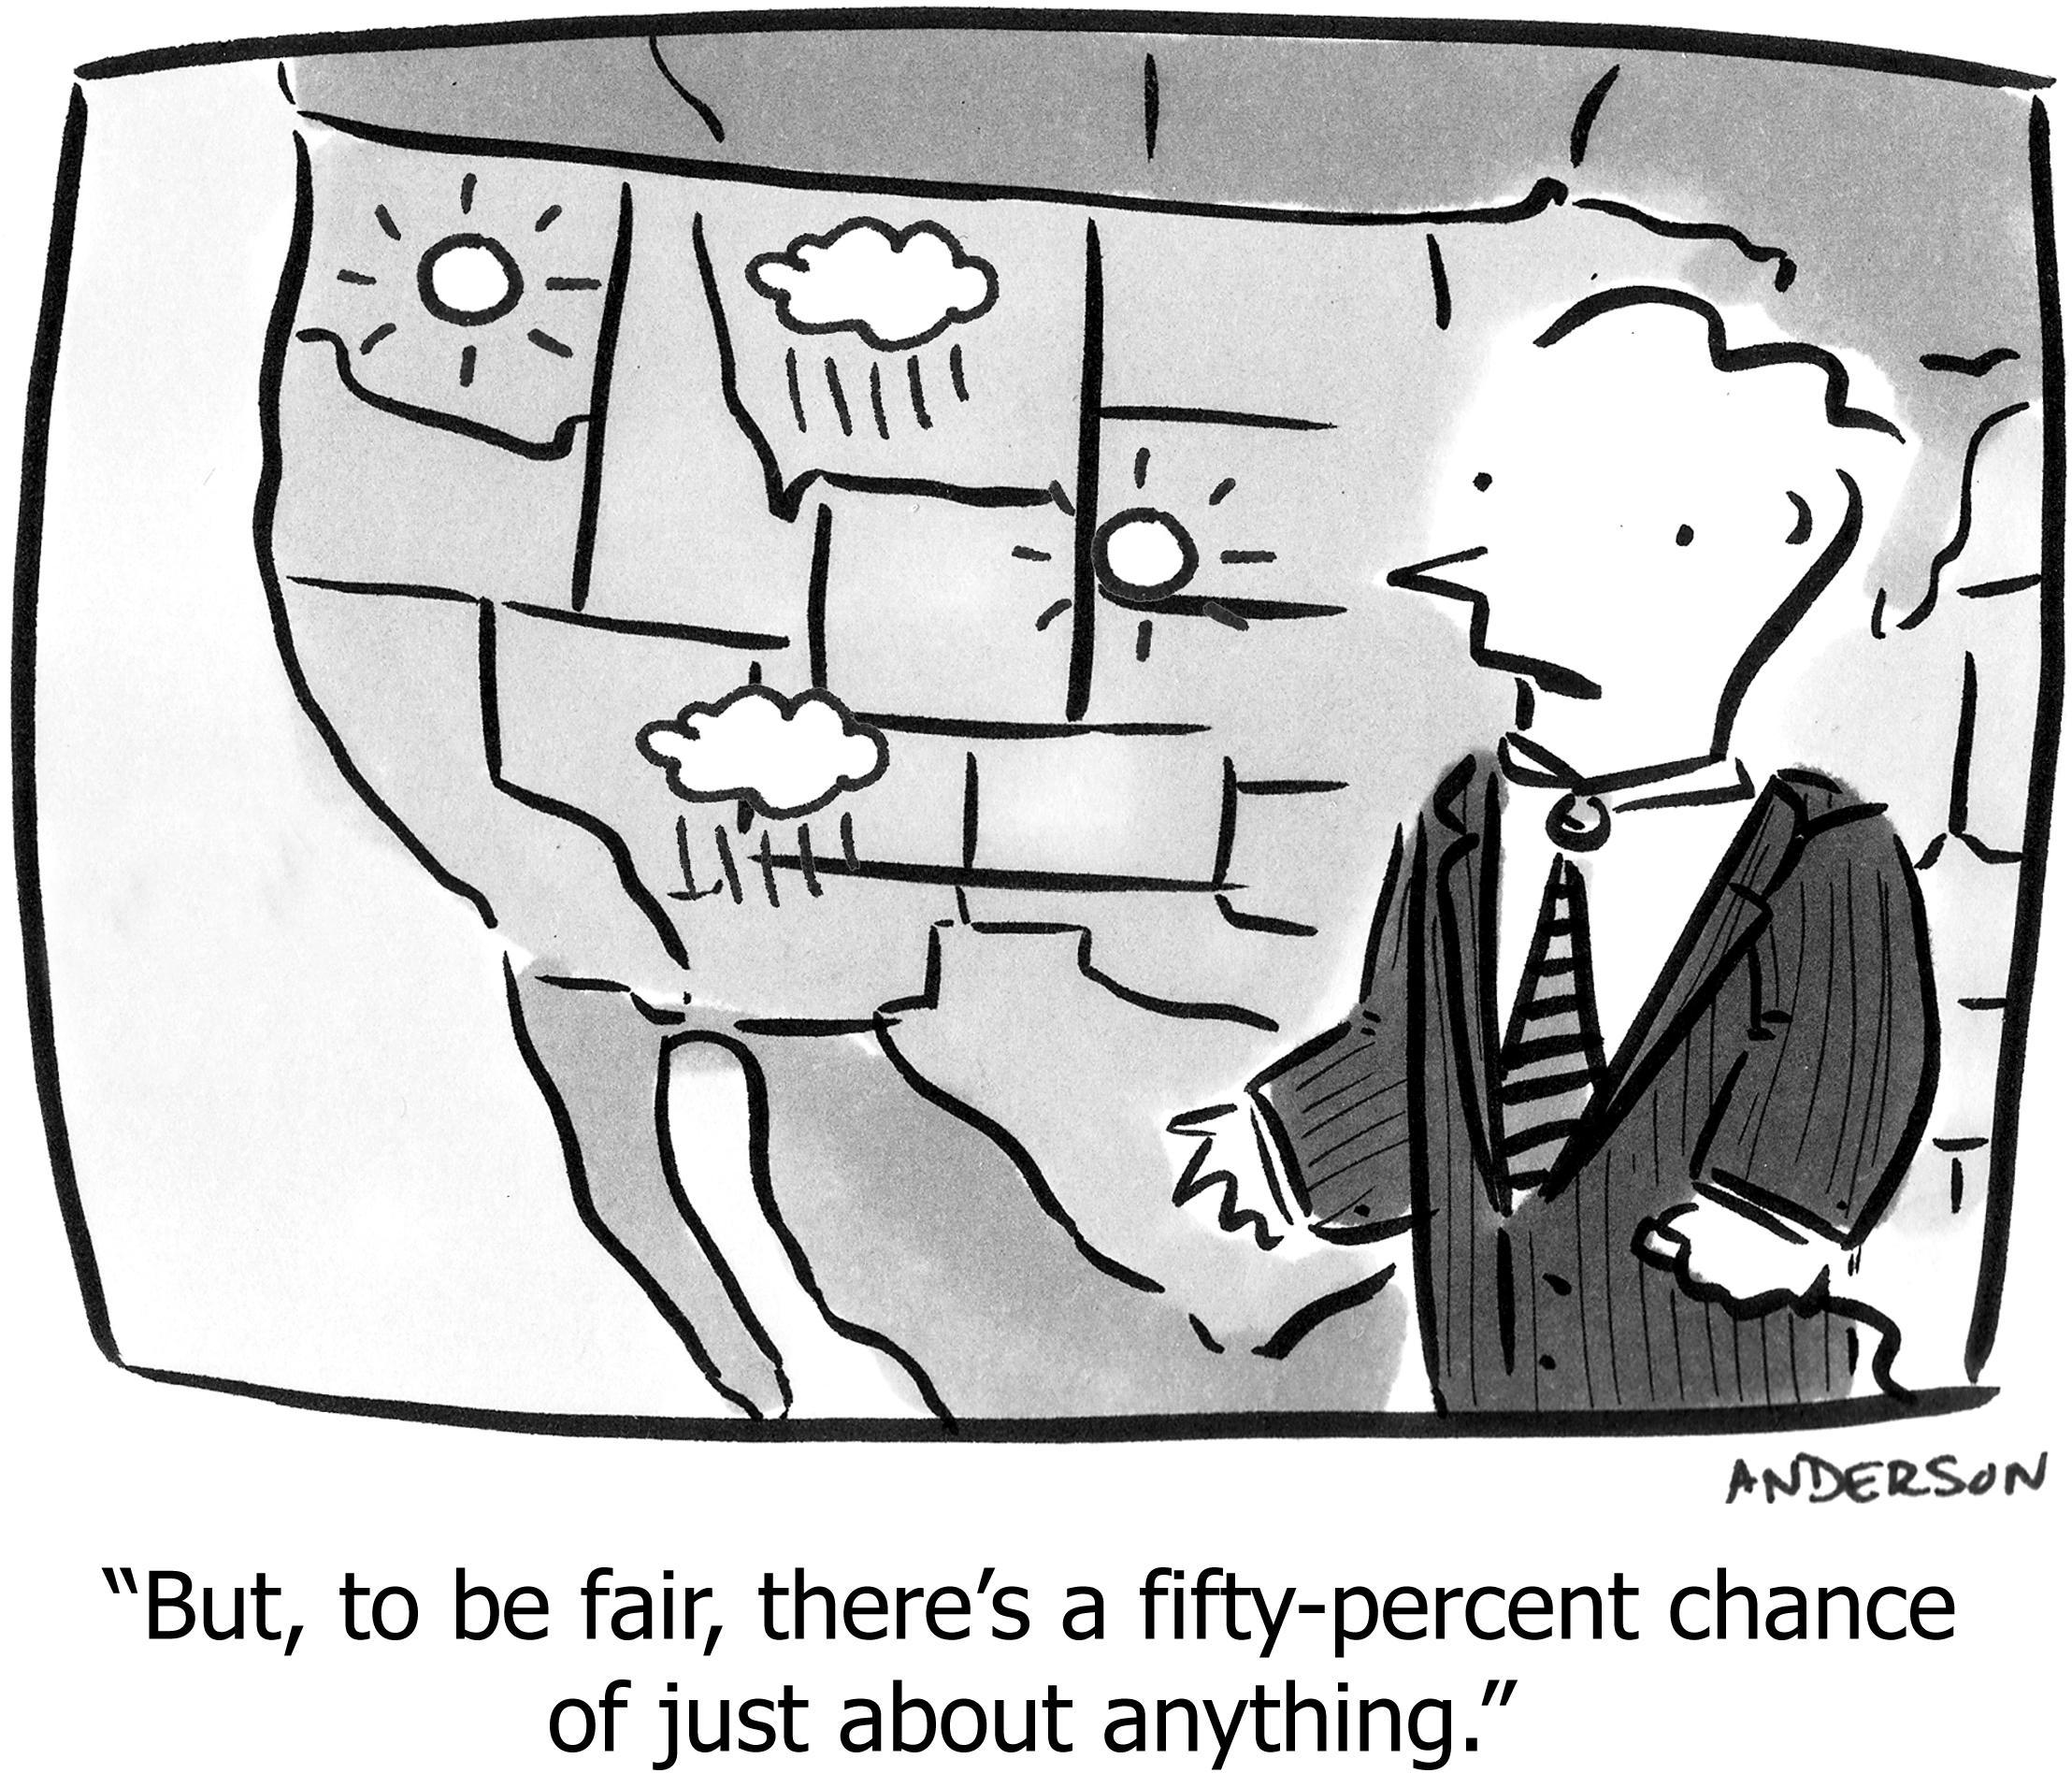
This is similar to weather forecasting. If there’s a 30% chance of rain, and it rains, was the forecast correct? While you cannot answer that for a single day, there is an answer across hundreds of days: You take all of the days for which the forecast was 30%, and see how often it did rain. If the real result is, say, 34%, the forecaster is doing a great job; if the real number is 70%, the forecaster needs improvement.5
5 Actually that’s not the full story; here is the fascinating math behind evaluating forecasts.

That’s great, but not for our Risk Slide. We don’t have hundreds of measurements from forecasts of well-defined events. We have a slide of a handful of independent, complex risks, none of which have ever happened before. So we can’t know whether our probabilities were correct, even years later when we know with complete certainty what actually happened.
So don’t put probabilities on the slide at all. Only list the risks that you feel are so important that they either merit action or awareness.
More examples
Now that the general pattern is clear, here are more examples to avoid:
- Measuring the effect of small design choices on user experience
- Things like color, typography, layout, and word-choice, definitely matter, but typically noise overwhelms signal in attempting to measure it, especially in small iterations, and it’s not effective to survey users about exactly which font they like better. Also, any UI change initially results in lower satisfaction scores, because people don’t like change.
- Measuring the effect or ROI of company culture or values
- Having a strong culture, with a specific direction, helps you create a healthy organization of people who are alike in the ways that matter, while creating diversity in all other ways. But, measuring the impact of a specific value or a specific culture-related initiative, doesn’t make sense.
- Measuring the value of brand
- While there are some techniques that could make sense for the largest companies in the world (e.g. “unaided awareness” or “brand recall”), you generally cannot look at winning specific deals, or competitiveness, or growth, and answer “How much of that was due to brand?” This includes marketing campaigns that are primarily about brand, such as company-sponsored events.
- Measuring the value of proactively fixing bugs or good engineering practices
- You cannot measure the impact of a bug that never shipped, or the impact of an engineering practice that is simply how you work. There is no counter-factual.
- Measuring “willingness-to-pay” or “value delivered”
- I’ve detailed a theory of willingness-to-pay as a path both to profits and genuinely happy customers, yet directly measuring “value” or “willingness” is elusive. Even if you raise prices, and measure the change in the number of new customers or the ire and cancellation of existing customers, that still doesn’t measure “value” or “willingness.” Anyway, that’s a test you cannot run often, and a test that’s often destructive for brand and customer relationships.
- Measuring the efficacy of employee compensation or retention programs
- Overall retention is easy and important to measure, but it is always multi-factored, and the rules can change over time. Thus this is like measuring the impact of a feature on product retention.
So stick with KPIs that measure specific aspects of your systems, and stay clear of things you cannot measure even after the fact.
https://longform.asmartbear.com/unmeasurable-metrics/
© 2007-2026 Jason Cohen
 @asmartbear


