 Simple eReader (Kindle)
 Rich eReader (Apple)
 Printable PDF
Fermi ROI: Fixing the ROI rubric

“Delivering maximum value in minimum time” sounds wise, but it’s not exactly a stunning insight. It’s not like we’re trying to take an eternity to deliver trivialities.
It is more analytical—but no more insightful—to insist on “Maximizing ROI.” Return-On-Investment is some measure of “value,” divided by some measure of “time,” yielding some measure of “productivity.”
With good intentions and this reasonable-sounding goal, we reach for the rubric: A spreadsheet of inputs of numeric “value” and “time,” a calculation of the metric of productivity, and an output where the best ideas are sorted to the top.
Invisible failures of the rubric
Unfortunately, the rubric fails us for several reasons. The failures are not obvious, so we don’t realize they’re happening. Explaining the traps will lead to a framework that avoids the traps.
“ROI” contains more noise than signal
Consider a feature that ended up producing 20% less impact and taking 50% more time than originally expected—a common outcome in the real world:
| Impact | Effort | ROI | |
|---|---|---|---|
| Estimated | 60 | 4 | 15 |
| Actual | 48 | 6 | 8 |
In this reasonable scenario, it ended up producing half the ROI than originally calculated. Therefore, in retrospect, the initial ROI estimate was largely noise. Apply this observation to a typical ROI rubric:
| Impact | Effort | ROI | |
|---|---|---|---|
| Feature A | 34 | 2 | 17 |
| Feature B | 60 | 4 | 15 |
| Feature C | 36 | 3 | 12 |
| Feature D | 10 | 1 | 10 |
The spreadsheet suggests (A) is the winner, and in particular that (A) is clearly better than (D). But neither of those statements are true. If (A) could easily result in half its stated ROI, there’s no objective justification to claim its superiority over (D), or over any other item.
Shocked at this revelation, we could react by ignoring the lesson. We could justify (A)’s supremacy by telling ourselves “estimation errors cancel themselves out.” But the errors do not cancel out. Effort is almost always under-estimated; 4-sprint projects that stretch into 6 sprints are not “cancelled out” by an equal number of 4-sprint projects that are completely finished in 2 sprints.
“Impact” is ill-defined
No matter how you measure impact, your numbers end up far less precise than they appear in the spreadsheet.
It’s difficult to predict numbers like “revenue-increase due to feature X.” Teams use various techniques to address the uncertainty, but in every case the number in the spreadsheet contains significant error:
- Revenue we would get from existing customers currently asking for this feature.
That’s precise but often uncorrelated with how much money we will make from it in the long run, so it’s not an accurate measure of impact. - Additional sales we would make in the next year if we had this feature.
This number is low-confidence, high-error. Even in hindsight it’s hard to attribute revenue from a single customer to a single feature; if it’s unmeasurable post hoc, surely it’s unpredictable ex ante. - Use a relative scale, e.g. “1-5,” calibrated by previously-created features.
Defined as “1 is like feature X, 5 is like feature Y.” Not only is this a wild guess, different people will interpret the scale differently, yet answers differing by a single point generates a large variance in computed ROI.
It’s even worse when want to combine multiple metrics of impact, e.g. revenue, unit-profitability, and retention. Each contains intrinsic error, then a mathematical combination compounds the error, then the ROI calculation expands the error yet again.
You can’t tell from glancing at the spreadsheet, because input numbers appear typical and output numbers boast many digits after the decimal place. But those digits aren’t indicative of precision. They’re a random number generator.
The Fermi Solution
These traps dictate requirements for a solution. We need scores containing dramatically more signal than noise. The scores must be well-defined, which means their definition and estimation should be obvious and uncontroversial.
Only Fermi estimations allowed
The first full-scale nuclear bomb was detonated at 5:29am, July 16, 1945, in the New Mexican desert of the United States. The physicists who invented it were huddled in a truck behind a plate of welder’s glass to reduce the radiation to non-lethal levels.
The physicists were already causing trouble. Future Nobel Prize-winner Richard Feynman inexplicably decided to observe the blast without eye protection, causing frightening but ultimately temporary blindness. Current Nobel Prize-winner Enrico Fermi had taken bets with military guards about how much of the atmosphere would ignite, and whether it would incinerate the entire state or the entire world; some of the guards asked to be excused from the base, angering the project director.

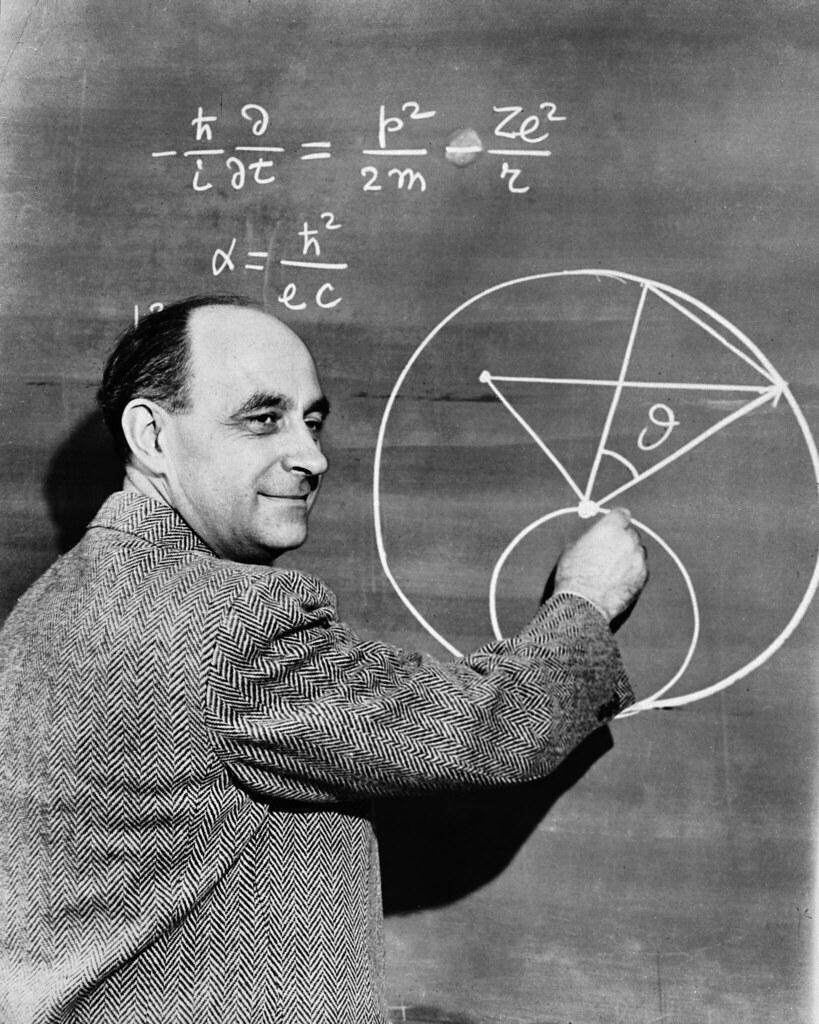
“ Enrico Fermi“ by Argonne National Laboratory is licensed under CC BY-NC-SA 2.0.
Fermi was also interested in the amount of energy released by the blast—one of the main goals of the test. Not wanting to wait for official analysis, he made his own estimate on the spot, using a technique that now bears his name, and that we will use to fix our rubric:
About 40 seconds after the explosion the air blast reached me. I tried to estimate its strength by dropping from about six feet small pieces of paper before, during, and after the passage of the blast wave. Since, at the time, there was no wind I could observe very distinctly and actually measure the displacement of the pieces of paper that were in the process of falling while the blast was passing. The shift was about 2 1/2 meters, which, at the time, I estimated to correspond to the blast that would be produced by 10,000 tons of TNT.
—Enrico Fermi, Top Secret interview July 16, 1945, declassified in 1965
The official estimate of the energy output of the blast was 21,000 tons of TNT. Fermi’s estimate was surprisingly accurate given such inaccurate input data and quick, simple, mental calculations. How did he do it?
The trick—useful everywhere in life—is to estimate values using only orders-of-magnitude, a.k.a. powers-of-ten. No “low/high ranges,” no precision, not even any digits other than a 1 followed by a quantity of 0s. It sounds far too imprecise to be practical, and yet Fermi’s bits of paper demonstrate that it just might work.

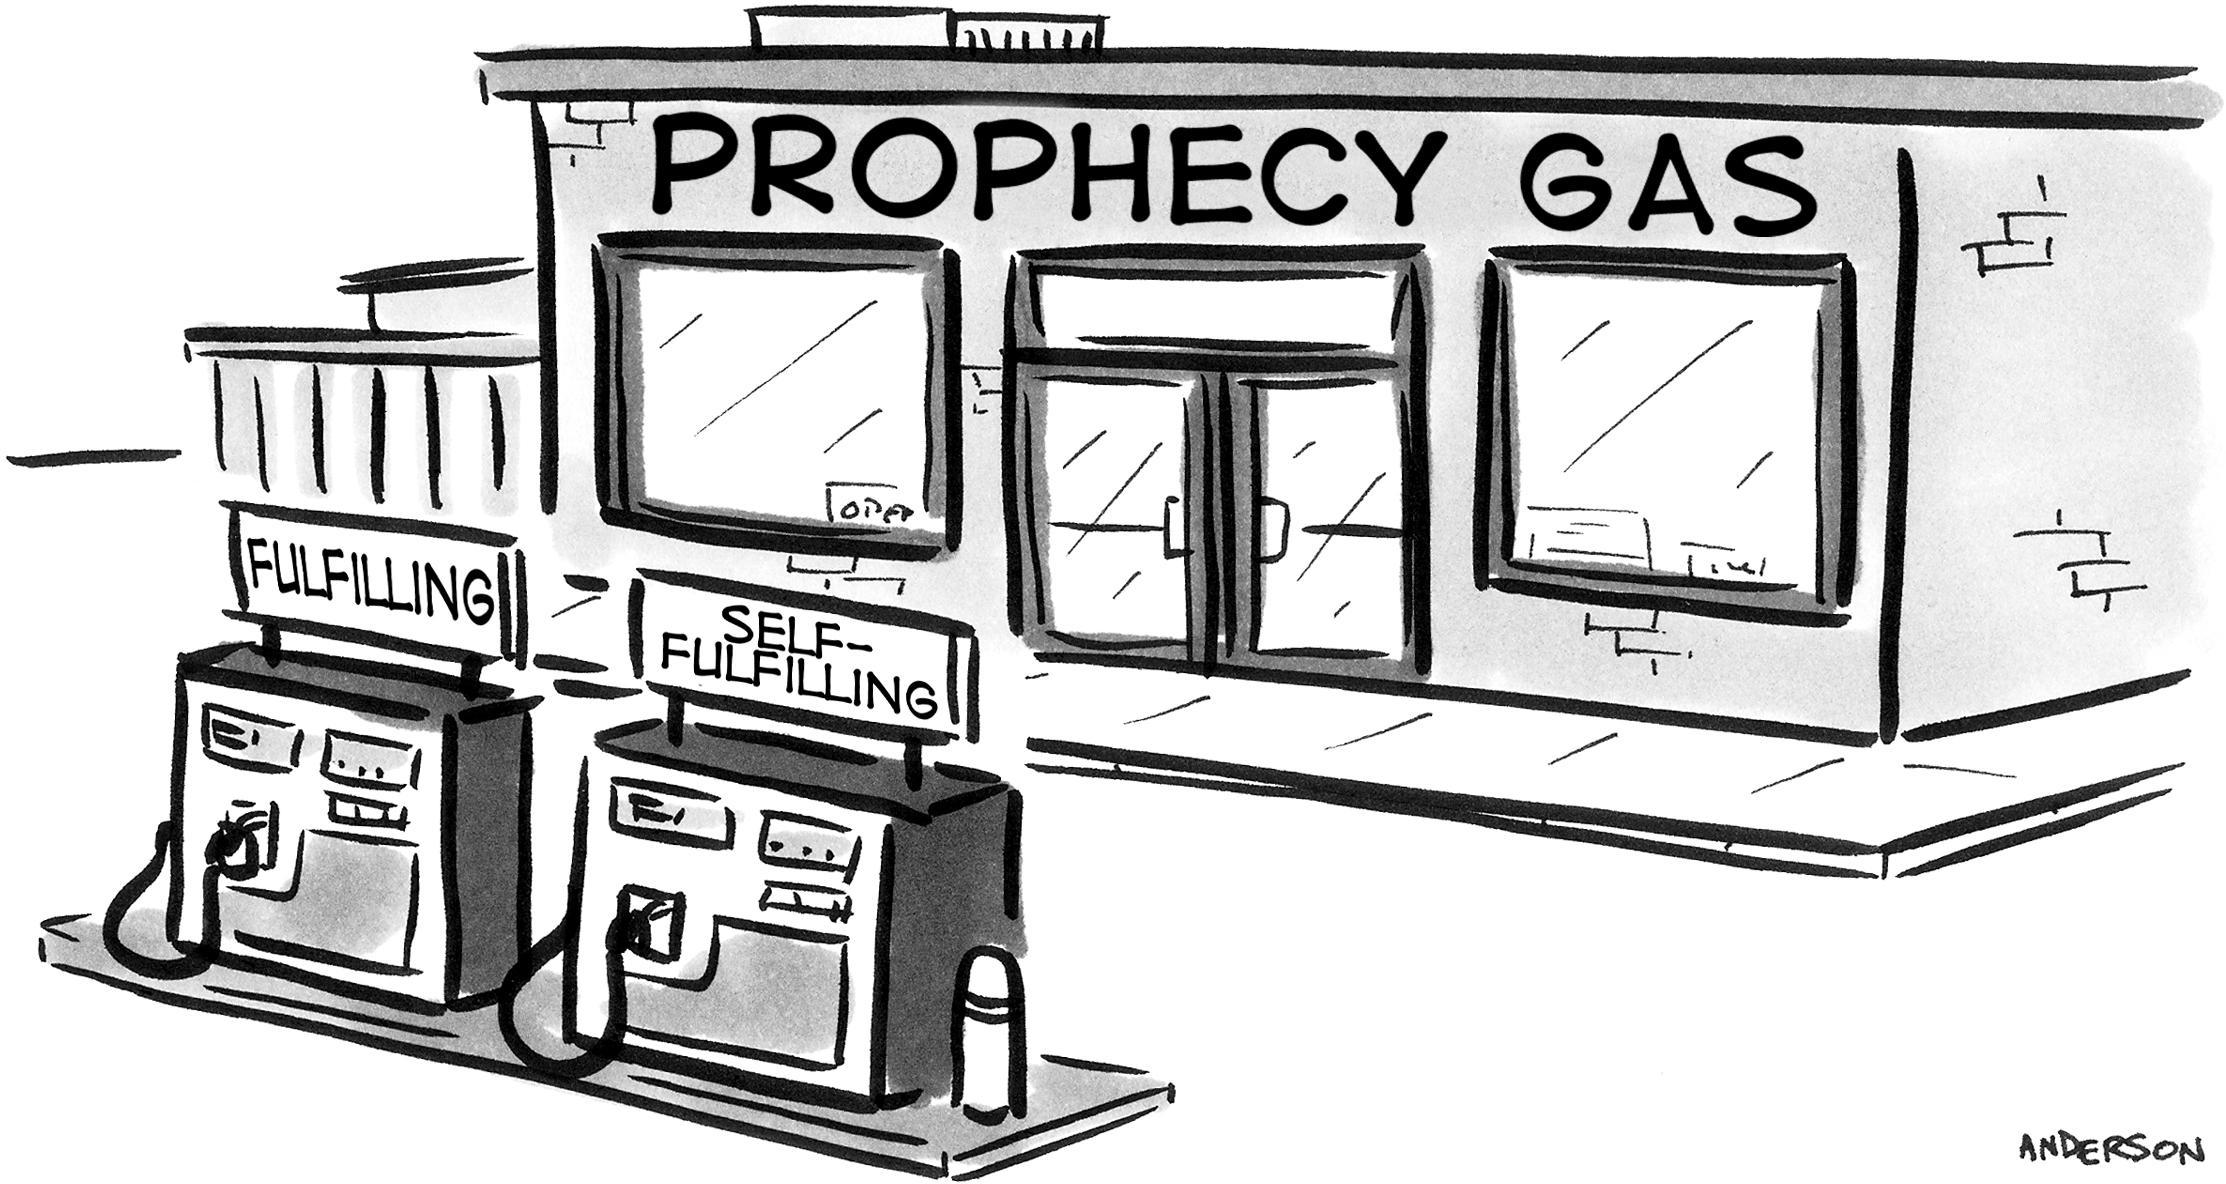
Joel Spolsky famously loved an interview question built for Fermi estimation: How many gas stations are there in Los Angeles County? “I don’t know,” although accurate, fails the interview. Fermi estimation, succeeds.
- There are 10 million people in the LA area (or at least, more than 1 million and less than 100 million, so by the rule of “only powers-of-ten,” our number is 10 million. The actual number in LA County happens to be 10 million).
- 1 car per person (or at least, not 10 and not 0.1. The actual number is 0.54).
- A person refills 1 time per month (the actual number is closer to 2.5/month, but it’s not 10 and not 0.1).
- A gas station handles 10,000 refills per month (200 per day yields 6000 per month; it’s not 1000 nor 100,000).
- With 10 million refills per month (10 million cars with 1 refill per month), divided by 10,000 refills per station, 1000 gas stations are required.
Despite being wildly inaccurate in detail, the end result of 1000 gas stations is indeed the nearest order-of-magnitude to the actual number of 600. Surprisingly accurate, considering we arrived at an answer in a minute or two, without looking up a single number.
What would happen if we used only Fermi estimates in our ROI calculator?
An immediate result is that most numbers are trivial to estimate. Note how easy it was to decide the values in the gas station example, because the two adjacent power-of-ten choices were definitely wrong. It’s nice to be so confident! Relish that.
Another result is that we’ve satisfied one requirement generated from the failures of the rubric: Scores are either identical or very different, causing calculation error to be small in comparison. The values are largely obvious and uncontroversial, if only because our artificial constraint on their values makes the adjacent choices absurd. This is progress.
Sometimes the numbers are still controversial, e.g. Could this product produce $1M in the next few years, or actually $10M because it would dramatically increase both retention and our ability to win new deals? But this debate is a wonderful use of our time, because it means people have wildly different assumptions, or different levels of optimism, or a different understanding of the customer, the market, or the idea. So another constructive result of Fermi estimation is that we spend our debate-time on strategic-level discussions, and no time on areas where we disagree in small degrees that are in any case overwhelmed by typical estimation-error.
In exchange for this progress, we lose precision. And admittedly, sometimes we do possess precise input data. For example, maybe we could look up the fact that the average number of cars per person is 0.54, and use that figure instead of 1. Surely it’s wise to retain precision whenever possible? Yes, but only if you recognize that, after doing math with other Fermi estimates, the end result is still not more accurate than the power-of-ten. That is, even using 0.54 instead of 1, as soon as you combine it with your extremely inaccurate estimate of 10,000 refills-per-station, you still have to zero-out all the digits in the result except the first one. You must meticulously discard the noise; if you’re diligent about that, your estimation is more accurate. Otherwise, maybe you should just enjoy the simplicity of the basic Fermi system.
So we’ve satisfied the first requirement. What about the final remaining requirement, which is to clarify the definition of “impact?”
Fermi Impact: Quantitive edition
Fermi estimation solves the puzzle of how to estimate the revenue impact of a sizable feature. We can pick any definition we want, but limit ourselves to Fermi estimation, and suddenly it becomes easy, or at least a simpler discussion. Any of these definitions could work:
- This feature will increase revenue by: $1k/mo, $10k/mo, $100k/mo
- This feature will increase new customers/month by: 1, 10, 100, 1000, 10,000
- The take-rate of this feature in our existing customer base would be: 1%, 10%, 50%
- The number of customers who would actively use this feature would be: 0.1%, 1%, 10%, 50%
We cheated a little in those last two, because “100%” is not a possibility. Still, a 5x separation is pretty good; the danger is when the difference is only 2x or 20%. This is still a much wider spread then, say, Fibonacci estimation.
It’s clear how this works with quantitative measures, but what about important things that are not numbers?
Fermi Impact: Qualitative edition
How you score things which aren’t numbers like “brand development,” “competitive advantage,” or “customer delight?”
The following is a real example from a few years ago, when WP Engine was launching a new product line called Atlas.1 We decided to build a thought-leadership presentation that would engage software developers on topics relevant to the new product line. We wanted it to be genuinely intriguing and useful. We brainstormed twenty-two topic ideas, all pretty good at first glance. How should we select just four or five topics, given that “intriguing” and “useful” are qualitative and subjective?
1 Tagline: The complete Headless WordPress Platform for absurdly fast dynamic sites.

First, we decided on our goal, even if impossible to measure, or not even a number. The primary goal was for everyone to come away loving the content and interested in our software. We broke this down into four sub-goals, where the overall goal would be achieved only to the extent that all four of the sub-goals were achieved:
- Topic is widely applicable
- Topic matters to real people
- Topic is insightful (i.e. non-obvious to a typical practitioner)
- Topic is relevant to specific features or capabilities in Atlas (i.e. self-promotion)
The next step was to convert these concepts into something we could “score,” i.e. specific questions that a person could contemplate and debate with another person. Otherwise, two people will have different ideas of what each goal means. The answers still won’t be numbers, but at least the questions are specific:
- How many customers care about this topic?
- How much do those customers care?
- How insightful is our perspective on this topic?
- How powerfully or uniquely does Atlas pay off the insight?
Because the answers aren’t things you can measure with numbers and units, we had to use some sort of “1-5” scoring system or, to take the Fermi lesson, powers-of-ten numbers. The key is to be specific as to what each number means, otherwise two people will have different interpretations for a phrase like “Insight is a 2 out of 5.”
1. How many customers care about this topic?
| Fermi Value | Definition |
|---|---|
100 |
Definitionally everyone |
70 |
Most |
30 |
Some |
0 |
I can think of one or two |
0 |
No one |
2. How much do those customers care?
| Fermi Value | Definition |
|---|---|
1000 |
Mission-critical to the success of their project |
100 |
“I care; this is a serious concern we’ve discussed internally” |
10 |
“I’m curious, tell me more” |
1 |
“Meh, whatever” |
0 |
“Don’t waste my time with this” |
3. How insightful is our perspective on this topic?
| Fermi Value | Definition |
|---|---|
1000 |
“Wow!!! This changes everything.” |
100 |
“I took notes, thanks, that’s a great point.” |
10 |
“Yup, OK, makes sense.” |
1 |
“No shit, Sherlock.” |
0 |
“No clue what you’re even talking about.” |
4. How powerfully or uniquely does Atlas pay off the insight?
| Fermi Value | Definition |
|---|---|
1000 |
“Whoa, I’ll buy Atlas just for that alone!” |
100 |
“Ohhh, nice, OK I’ll take a look.” |
10 |
“That’s fine.” |
1 |
“So what?” |
0 |
“I actively do not want this.” |
The combination of Fermi values and specificity in both the questions (rather than broad concepts) and values (rather than “1-5”) made it easy to score. Because “all four” scores were required to deliver on the original goal, multiplying the scores2 sorts the best to the top.
2 The mathematically-inclined reader might point out that because all values are powers-of-ten, the operation “multiply everything and sort” yields exactly the same result as “Number these 1-5, then add everything and sort,” because the latter is just the logarithm of the former. Why, then, bother with Fermi values? (a) As in the first question, specific values (as opposed to strictly only powers-of-ten) might have a valid meaning, which creates different values from “1-5.” This “breaks ties” in a meaningful way. (b) By emphasizing that the values are designed to be widely divergent, we generate better specific phrases, and more agreement in scoring each topic, and therefore hopefully a more accurate output.
It worked; the presentation was routinely scored “5 out of 5” in post-event surveys,3 and the biggest complaint was a desire for even more detail. That is a “complaint” indicative of success: It means “I want to hear more from you,” and therefore is further evidence that the choice of topics was spot-on.
3 Oh the irony of scoring the presentation 1-5 after everything we just said!
Fermi time estimates
We’ve explored how to estimate “impact” with Fermi-approved values, but what about time-estimates? Those also exhibit large errors. They, too, need the Fermi treatment.


Nearly twenty years ago, before Scrum defeated rivals like Extreme Programming to become the de facto standard for waterfall-averse software developers, our engineering team at Smart Bear Software used a simplistic but effective method of estimating work. Our software was installed on-premises by customers (this was The Time Before SaaS), so “continuous deployment” was impossible. Instead, we made a few major releases per year, supplemented with minor bug-fix releases. We planned about four months of work at a time.
We scrawled each idea on an index card, with only enough space for a title and a few bullets about scope and intent. We placed time estimates in the bottom-right corner, but the only three choices were: 2d, 2w, 2m—two days, two weeks, or two months.4 Whatever you think the real estimate is, round up.
4 I hear you yelling “No! Story Points!” Hang in there, it’s OK, this was long ago in the Third Age when the Elves still abided in Middle-Earth. Elves don’t use story-points.
The overwhelming majority of cards generated no disagreement over the estimate; this saved us hours of analysis and debate. The controversial ones were always a matter of definition and scope, which is a typical and important conversation to have, regardless of your system for estimating work.
To select the items and plan team capacity, we spread the cards across a table, and each person held the set of cards they were going to execute. The project time frame was measured in weeks; a typical window was 16 weeks. We used a rough conversion that two 2d cards equals one week, and one 2m card equals eight weeks.5 It was easy to see who was over- or under-scheduled, and then load-balance according to capacity and ability.
5 You might wonder why we didn’t just use a mathematically identical scale like0.5w, 2w, 8wor some abstract unit of “effort” that could scale like1,4,16, or a Fibonacci number of weeks. The reason for using real time is that we felt it was easier to imagine than abstract units. The reason for keeping the quantity of values to three is the Fermi reason: This minimizes controversy and forces you to think critically about scope.
If a project required multiple cards (nowadays we’d call that an “epic” or “big rock”), we marked that set of cards with a color. The idea is that either all the cards of that color should be accepted, or none, otherwise we would have spent a lot of time on something without having shipped a usable feature.
Here’s the punchline: It typically took a few hours to create the entire plan, and four months later we typically hit the plan within a week of the original estimate.
In retrospect, it’s a form of Fermi Estimation. It’s not exactly powers-of-ten, but measured in work-days it’s close: 2 vs 10 vs 45. Essentially powers-of-five, it still maintained the key idea of Fermi—to have so few choices that the correct one is easy to identify—while also being chunks of time that a human can relate to.
Putting it together
Let’s combine these ideas, do the math, and decide whether it’s helping us make better decisions.
Single-valued impact
Suppose we’re picking features to implement, and the only metric of value is the revenue we believe that feature will generate in the next twelve months. We’ll convert “effort” into work-days as given just above, and round ROI to the nearest 10% to make it easy to read. Here’s a typical result:
| NTM Revenue | Effort | ROI | |
|---|---|---|---|
| Feature A | $100,000 | 2m | 2200 |
| Feature B | $10,000 | 2w | 1000 |
| Feature C | $1,000 | 2d | 500 |
| Feature D | $10,000 | 2m | 200 |
| Feature E | $1,000 | 2w | 100 |
This has some nice properties:
- Biased towards more impact
- Products A and B are examples of “takes more time, but generates more impact.” The rubric prefers more impact, even compared to “quick wins.” This is a good bias, especially since impact in reality is often less than we had hoped.
- Still correctly ordered if we misjudged
- Consider what happens if we misjudge impact by 20% and effort by 50%—the original hypothetical from the beginning of this article. If Feature A delivered only $80,000 and took three months, the actual ROI would be about 1200, still ahead of Feature B. Or if Feature B delivered $8,000 in three weeks, actual ROI is 533, still ahead of Feature C. Therefore, typical misjudgments are not changing our decision. We fixed that deficiency.
- Easy to explain to others
- It’s important to be able to explain your decisions crisply. The typical ROI rubric does not; the explanation is that one item slightly edged out another item, which isn’t confidence-inspiring, and doesn’t sound like a strategic decision. In contrast, Fermi ROI is easy to summarize; for example, why Feature A was selected: Feature A has by far the greatest potential for impact. The impact is so large, it’s worth spending multiple months on it. Or why Feature B wasn’t selected: Feature B would be faster to implement, and therefore is a great idea, but Feature A’s impact is so much larger, it’s still the better choice. If we get part-way into Feature A and realize it’s much harder than we thought, or much lower impact than we thought, then we’ll pivot into Feature B.
Multi-valued impact
In the “presentation” example, we had four impact scores, which we multiplied together. The reason it made sense to combine them in that way, is that all four are required to achieve the goal (as explained previously). When you have a case where multiple factors are needed together to achieve a singular goal, then multiplying is the correct way to compute the score for that goal.
A common mistake is to use this formula when there are scores for things which are not related. For example, suppose you’re wanting to maximize revenue, and also customer delight. You could make a Fermi score for each, but how do you combine them to get an ROI?
There are two answers, depending on your philosophy:
- Do not combine unlike attributes
- There is no way to compare “revenue” with “delight.” These are different units of measurement, so any combination is nonsensical. Instead, decide which of the factors is most important, and compute the ROI of just that. Then, if there is a tie, you can break the tie by comparing “delight.” This is also easy to explain after the fact: Features A, B, and C are equally effective at generating revenue, which is our most important goal. Among those, Feature B also increases customer delight more than the others, so we’re implementing B.
- Add instead of multiply (only when attributes are equally important)
- Although it is arguably a lack of strategic decision-making to claim that multiple attributes are all equally important, it can make sense if you are scheduling secondary features. That is, suppose you’ve already scheduled the most important strategic items, and now you’re “filling in” with “quick wins” where you truly don’t care in what manner each is a “win.” Here you add the values instead of multiply. This way, a huge ROI in one area wins (but we don’t care which area). Getting some value in two areas, is not as good as getting a lot of value in one area. This final point is satisfied when you use Fermi values, but traditional rubrics get it wrong.
Breaking ties
The Fermi-style rubric has another interesting property: There are only a few unique values of ROI. In the “revenue” example above, there are only 3 realistic numbers for revenue, and only 3 values of effort, so only 9 unique combinations of ROI.
The good news is, the computation clearly separates the best from the rest. The bad news is, you can easily make ties. In the “presentation” example earlier, in real life we had two topics in clear first and second place, but a three-way tie for third. We didn’t have time for all five topics, so we had to break the tie.
These ties are not a failing of the system. Just the opposite: It means we are able to identify ties, rather than allowing noise to trick us into believing one is the “winner.”

Still, we have to break the tie. There are several ways to do it, while preserving the advantages of this method.
Adding precision or intentional bias
It’s tempting to add “precision” to your input values, and indeed that might break the tie. But beware of falling back into the accuracy problem and the explanatory deficiency of typical rubrics.
You should add precision only if:
- You are certain the precision is accurate, or
- You are creating an intentional bias, e.g. to over-weight one factor relative to another.
There’s a mathematical trap in option (2). It’s tempting to “weight” a factor by multiplying it by a constant, e.g. “we’ll double this score, so it counts twice as much as other scores.” However, this actually doesn’t do anything at all, because it just means all totals for all items are multiplied by 2; this doesn’t change the ordering, and doesn’t break ties.
Instead, what matters are the sizes of the intervals between the choices. That is, if scoring for this item was originally 1, 10, 100, you could reduce how sensitive the total is to this value by diminishing the differences between values, e.g. by going up by powers of three instead of powers of ten: 1, 3, 9.
You also don’t need to keep the spacing regular. You might rank more options as a 0 to effectively “filter out” things that don’t meet a desired standard. You might decide that the two options at the top of the scale, that originally were 100 and 1000, should be more like 800 and 1000, reflecting a bias that “both options have essentially the same value, one just slightly more.”
The run-off
Given a set of items that we’ve agreed are “equal in ROI,” pick a new dimension to break the tie.
Time-estimates are no longer part of the process. We already agreed these are efficient in terms of impact-versus-time, so now we focus only on some additional dimension of value. This simplifies the process, which is not only nice for decision-making, but also for explaining the decision.
If you don’t want to evaluate the items along a new dimension, you could eliminate some of the existing dimensions. For example, in the “presentation” case, we decided that, all else being equal, we would rather select topics where we have a really interesting insight, rather than topics that are great at selling the product. Therefore, we performed a run-off using “insight × reach,” ignoring the other values.
To determine which is the most important dimension to maximize, using this guiding question:
If we maximize this dimension in the next few months, then even if we get nothing else accomplished, it will still be a success.
Conversely, if we moved other needles, but this dimension remained unchanged, it will have been a failure.
The human factor
A different way to break the tie is to include something else that you value, but that shouldn’t be used to make the primary decision.
Since the primary decision is a tie, we’re “allowed” to indulge ourselves in something else, even something unconnected to “business metrics” in the usual sense. Because we’ve already maximized a business metric, you could break ties using something completely different:
Team Excitement
Whether because it’s fun, interesting, or the team is just tired of hearing certain customer feedback and really wants to do something about it, “excitement” is an excellent, under-appreciated attribute. Excited teams are happier, feel more fulfilled, feel more listened-to, and work harder and better. It is the elusive “win-win.”
Since “excitement” is an ambiguous term, one way to convert to a Fermi value is the following:
| Fermi Excitement |
Definition |
|---|---|
0 |
No one is excited to work on it. |
1 |
One person is excited to work on it. |
10 |
About half the team is excited to work on it. |
100 |
All, or all but one, is excited to work on it. |
Confidence
Confidence is hard to measure, but you know it when you feel it (or don’t feel it). It might not be correlated with risk—just because you are confident, doesn’t mean you are correct. Still, faced with two choices, where you’re sure you know how to execute the first, but with the second you’re full of doubt, it’s logical to pick the first.
Since “confidence” is an ambiguous term, some people use some sort of risk percentage, e.g. “I’m 60% sure we can do this.” But pinning down a number is suspicious, and debates don’t seem fruitful. One way to convert to a Fermi value is the following:
| Fermi Confidence |
Definition |
|---|---|
0 |
There’s no way we can pull this off. |
1 |
I mean we can try, but don’t be surprised when it fails. |
10 |
We can probably do this; we’ll be surprised if it goes very wrong. |
100 |
This is completely within our domain of expertise, we’ve successfully executed something similar in the past, and nothing in the task-breakdown is uncertain. |
Good luck!
https://longform.asmartbear.com/roi-rubric/
© 2007-2025 Jason Cohen
 @asmartbear


